How to Find the Queue States Eating Your Delivery Time (One Approval Step Held 40% of Ours)


When delivery slows down and deadlines start slipping, the response is almost always the same: push harder. Longer hours, more effort, more pressure on the team. Sometimes fingers start pointing.
And I get the instinct. Effort is the part of delivery everyone can see, so effort is where the pressure goes.
But effort isn’t always the issue, and today I want to show you where the time actually goes, using a story from one of my own teams. By the end of this piece, you’ll know how to find your version of our number, and exactly what to say to the person who can fix it.
Where Delivery Time Actually Goes
Follow a piece of work from the day it starts to the day it reaches your customer. The surprising thing is, a huge chunk of that journey, often somewhere between 60% and 95% of the total delivery time, turns out to be waiting time. For most of its life, the work is standing in lines between the activities.
In Kanban, those lines have a name: queue states. Think of the “done” and “ready for” columns sitting between your activities. They’re passive. No one works on tasks in the queue states. The work is finished from one activity’s point of view and untouched from the next one’s, and the clock runs anyway.
And that’s the good news hiding in this picture: you can achieve tremendous improvement in your delivery speed just by reducing that time. No new hires, no overtime, no pushing.
One Approval Step, 40% of Our Delivery Time
Let me show you what that looks like in practice. On one of my own teams, we discovered that a single approval step was responsible for 40% of the delivery time. Just one step! Work arrived at it and sat, waiting for the one person who could approve it.
Out of every five days of our delivery time, two went to waiting for that sign-off.
So how did our story end? Did anyone start working faster? No. Did we hire? No. We gave a second person the authority to approve the work, so approvals kept flowing when one person was busy. The results? Cycle time dropped by 40%. No extra approval steps, no additional team members, no extra investment.
A simple fix. But we would’ve never caught it without the data. The analytics showed us exactly where the slowdown was happening. And once you can see the bottleneck, you can fix it.
Why This Delay Belongs to Leadership
Now look closer at the fix, because this is the part most delivery conversations miss.
The team’s work stayed exactly as it was. What changed was a rule: who is allowed to approve. And rules like that, who signs off, how many people can, what needs a signature at all, get set above the team’s board. A team can work nights and weekends, and their work will still wait for the same signature.
That’s the bind. The pressure for faster delivery lands on the people doing the work, while the biggest share of the delivery time sits inside a policy they have no authority to change.
You’re probably thinking, but Sonya, that approval exists for a reason. We can’t just wave work through. You’re right, and nobody should. In our case the check stayed: every piece of work still got approved. What went away was the waiting. A check is often worth keeping. A wait rarely is.
So shift the focus from the people to the work itself, and make the waiting visible to the person who owns the policy. No one removes a delay they can’t see.
Find Your 40%
Here’s your action item. Pull your last 20 to 30 completed items and split their cycle time by process state, so you can see what share of the total the work spends in each step. Then find the biggest slice that belongs to a queue, a step where work waits for a signature, a decision, a release. That’s your number.
Here’s what it looks like. On the cycle time breakdown below, 240 items spent a combined 1,092 days sitting in Ready for Deployment. That queue accounts for the single biggest share of delivery time, 33%. Everything in it is finished and waiting to go out. Development, the step where the work actually gets built, takes 22%. Can you see what that means? One waiting step costs this system more time than all of its development.
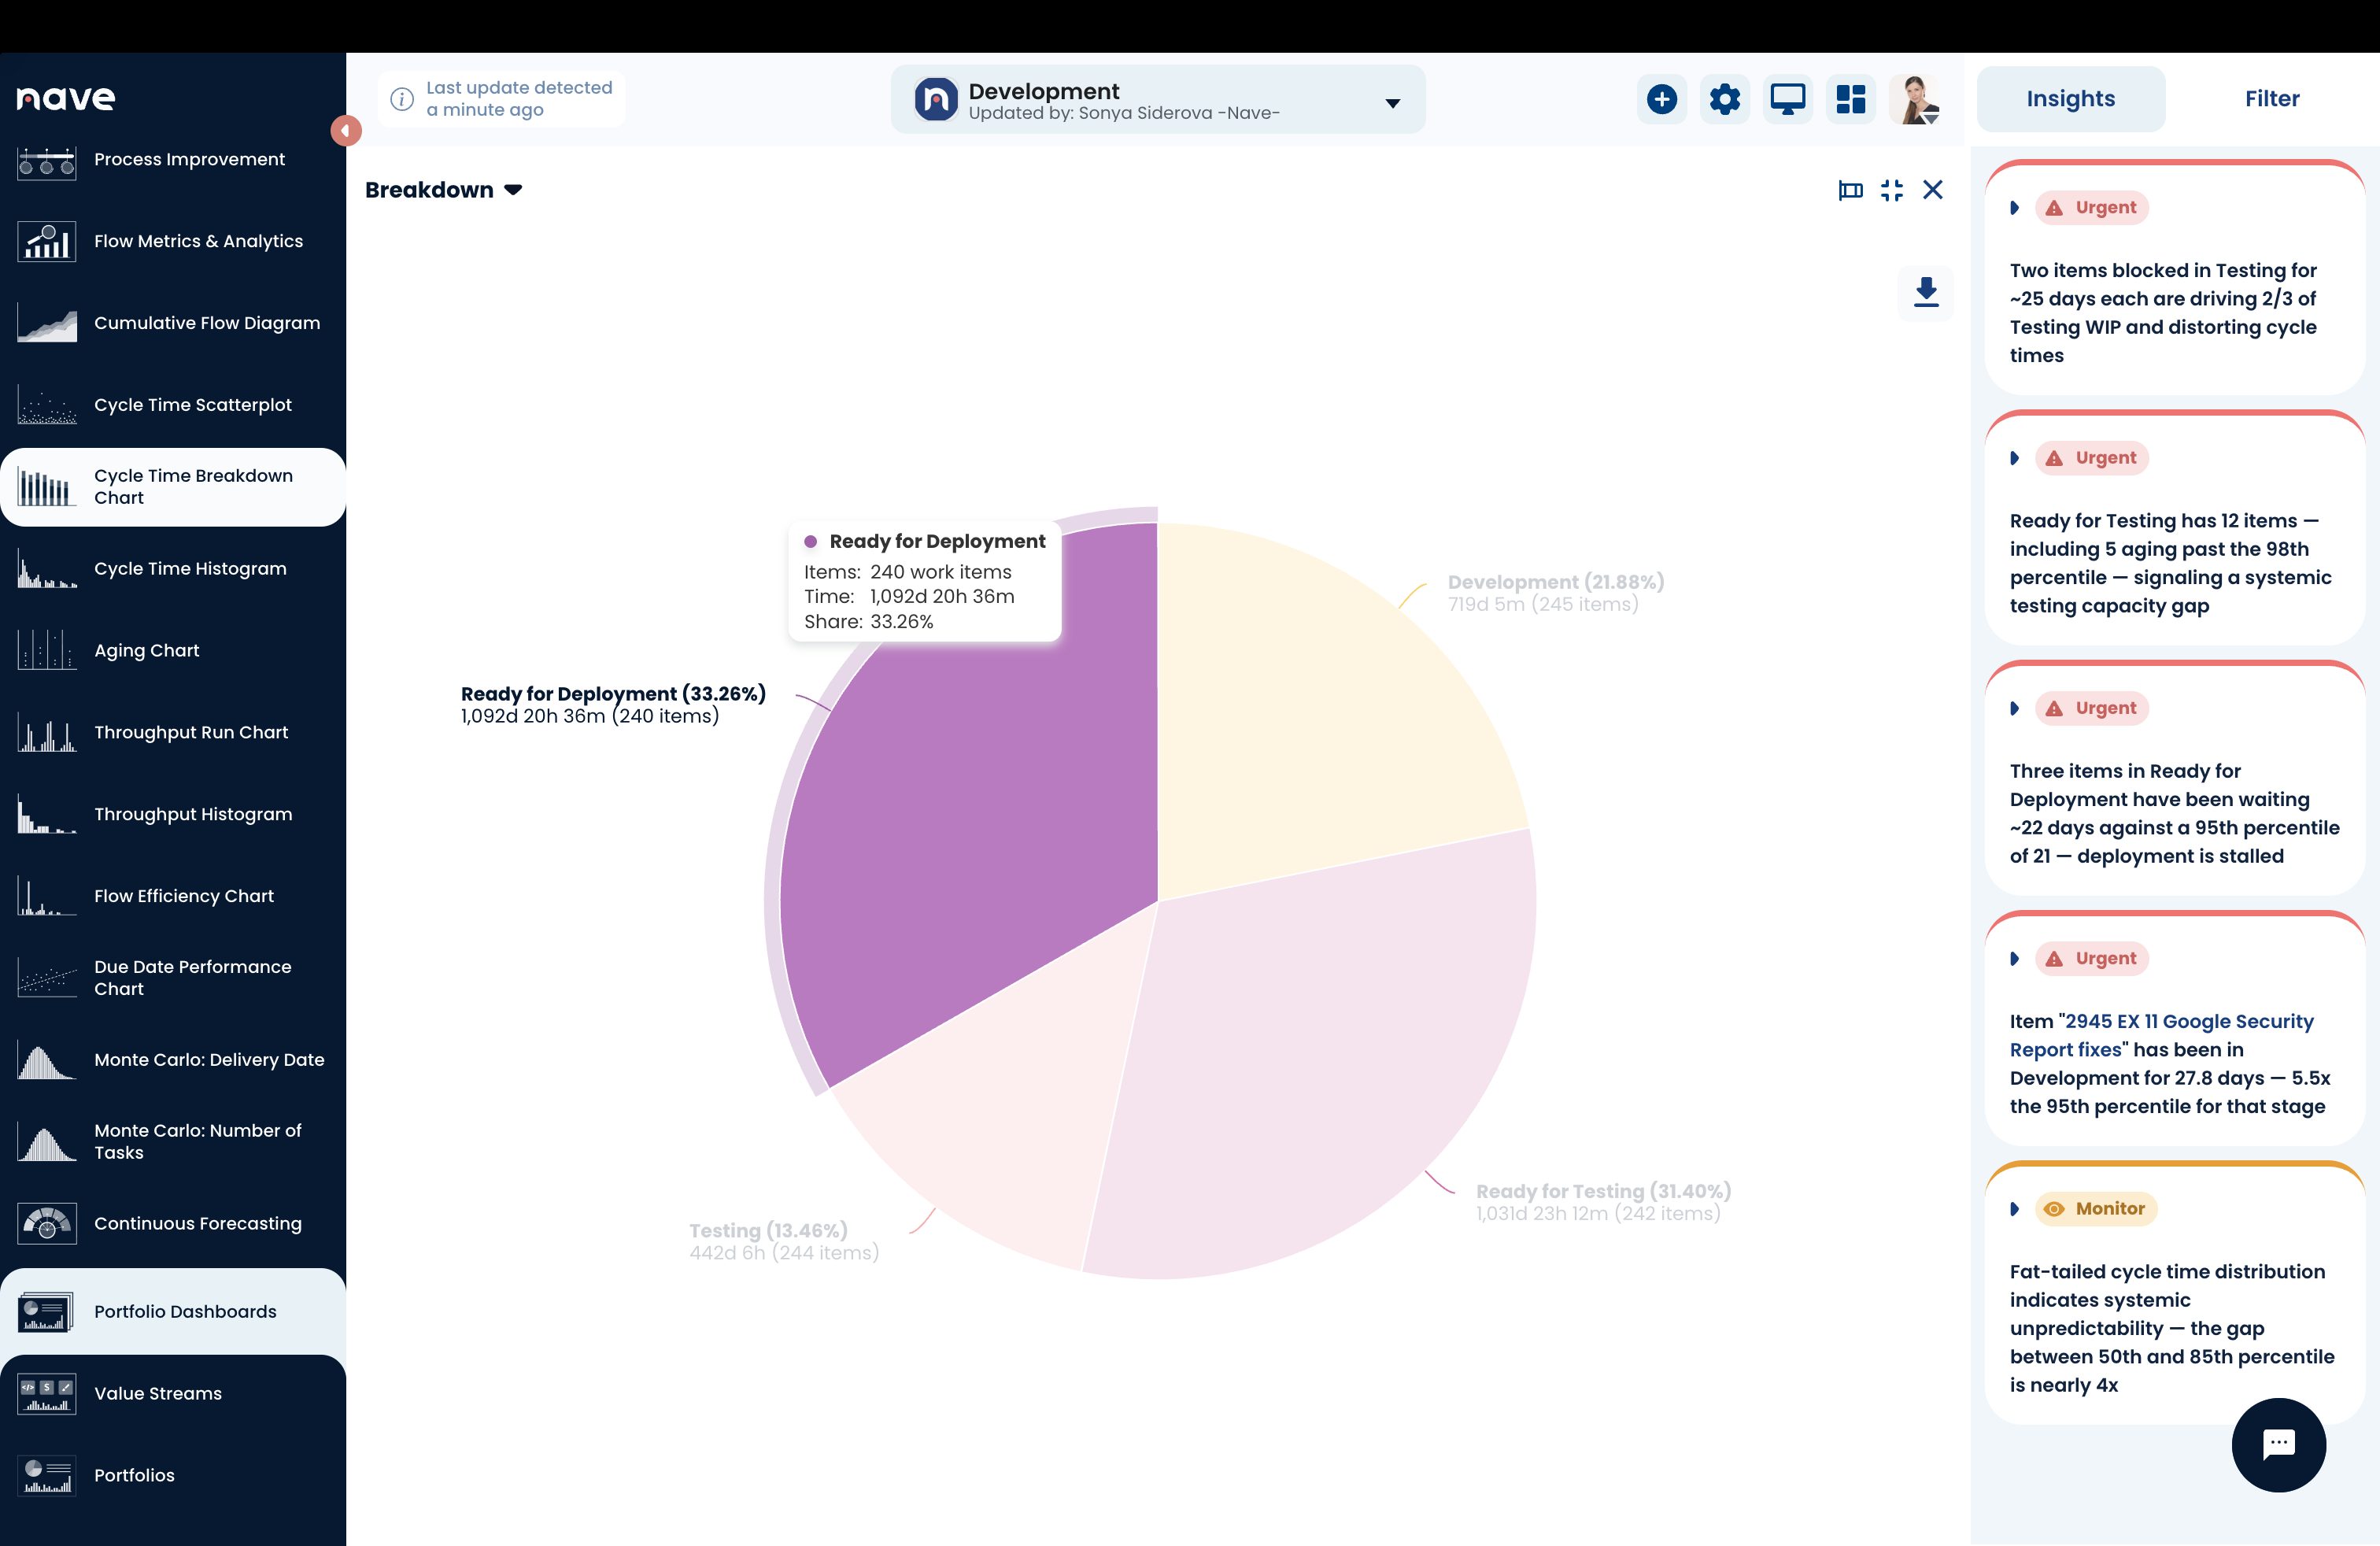
The cycle time breakdown chart in Nave: the share of total delivery time work spends in each process state. The biggest slice, Ready for Deployment at 33%, is a queue state, a bigger share than Development at 22%. Learn more at getnave.com.
Then take your number to the person who owns the policy, and say it like this: one step of our process holds work for a third of our delivery time, and nothing happens to the work while it sits there. Shortening that wait speeds up everything we deliver, and it asks nothing extra of the team. It takes a policy change, and that change is yours to make, which is why I’m bringing it to you.
And if your biggest slice turns out to be an activity instead of a queue, you’ve learned something just as useful: the delay lives in the work itself, and that’s a conversation your team can own.
Book the half hour for the breakdown on your calendar tomorrow morning. If you don’t schedule it, you won’t get to it.
If you want to see where the time is actually going in your own workflow, the breakdown chart in this piece is Nave’s, and you can run the same analysis on your own data. Learn more at getnave.com.
Effort isn’t always the issue. In our case, 40% of the delivery time sat in one approval step, and no amount of pushing would have shortened it. One decision did.
Thanks for tuning in! I’ll see you next week, same time and place for more managerial goodness. Bye for now!