From Two Hours in Excel to Accurate Delivery Dates: How Stoque Uses Nave to Keep Lead Time Predictable


Stoque’s product and innovation team is small: one team, eleven people, serving a SaaS product with hundreds of customers. Their goal is straightforward: keep delivery moving at a high rate while making lead time predictable enough to give other teams reliable delivery dates.
The team has used Nave for years, first with Asana and, since November 2023, with Azure DevOps. Today, Nave is part of how the team manages work every day, reviews delivery every couple of weeks, and tracks its goals each month.
Two Hours a Month Just to Track the Goals
Before Nave, producing a status or metrics report meant reviewing delivered work items through Asana’s search functionality and using Excel to track whether the team’s goals were being met.
“That took at least two hours per month.”
When the team started using Kanban, the questions went beyond whether work had been delivered. They wanted to identify bottlenecks, understand throughput, and track lead time. Those were the delivery signals they needed in order to manage the flow of work.
Nave gave the team a way to make those metrics part of the way they run delivery, rather than a separate reporting exercise.
One Set of Metrics, Three Operating Rhythms
Today, the team uses Nave at three different cadences.
Every day, during the Kanban meeting, the team looks at work item aging so it can unblock or prioritize work. Every couple of weeks, during review meetings, it looks at delivered work to capture lessons learned and identify blockers. Once a month, the team uses Nave to track its OKRs and goals.
Daily, every couple of weeks, and monthly. The same delivery data supports each conversation.
What Leadership Can See Now
“Our leadership can now see the bigger picture that the Asana reports and Azure DevOps dashboards don’t show.”
That bigger picture matters beyond reporting. The team can see whether its throughput is predictable and whether its lead-time goal is being met. It also uses lead time to give other teams more accurate delivery dates for new features.
Throughout 2025, Stoque kept 85% of its work items within a 32-day lead time.
The Cycle Time Scatterplot for the full year shows the 85th percentile at 32 days and the 50th percentile at 18 days. For Stoque, the important point is not simply the number itself. The team has been able to keep that lead-time performance predictable across the year.
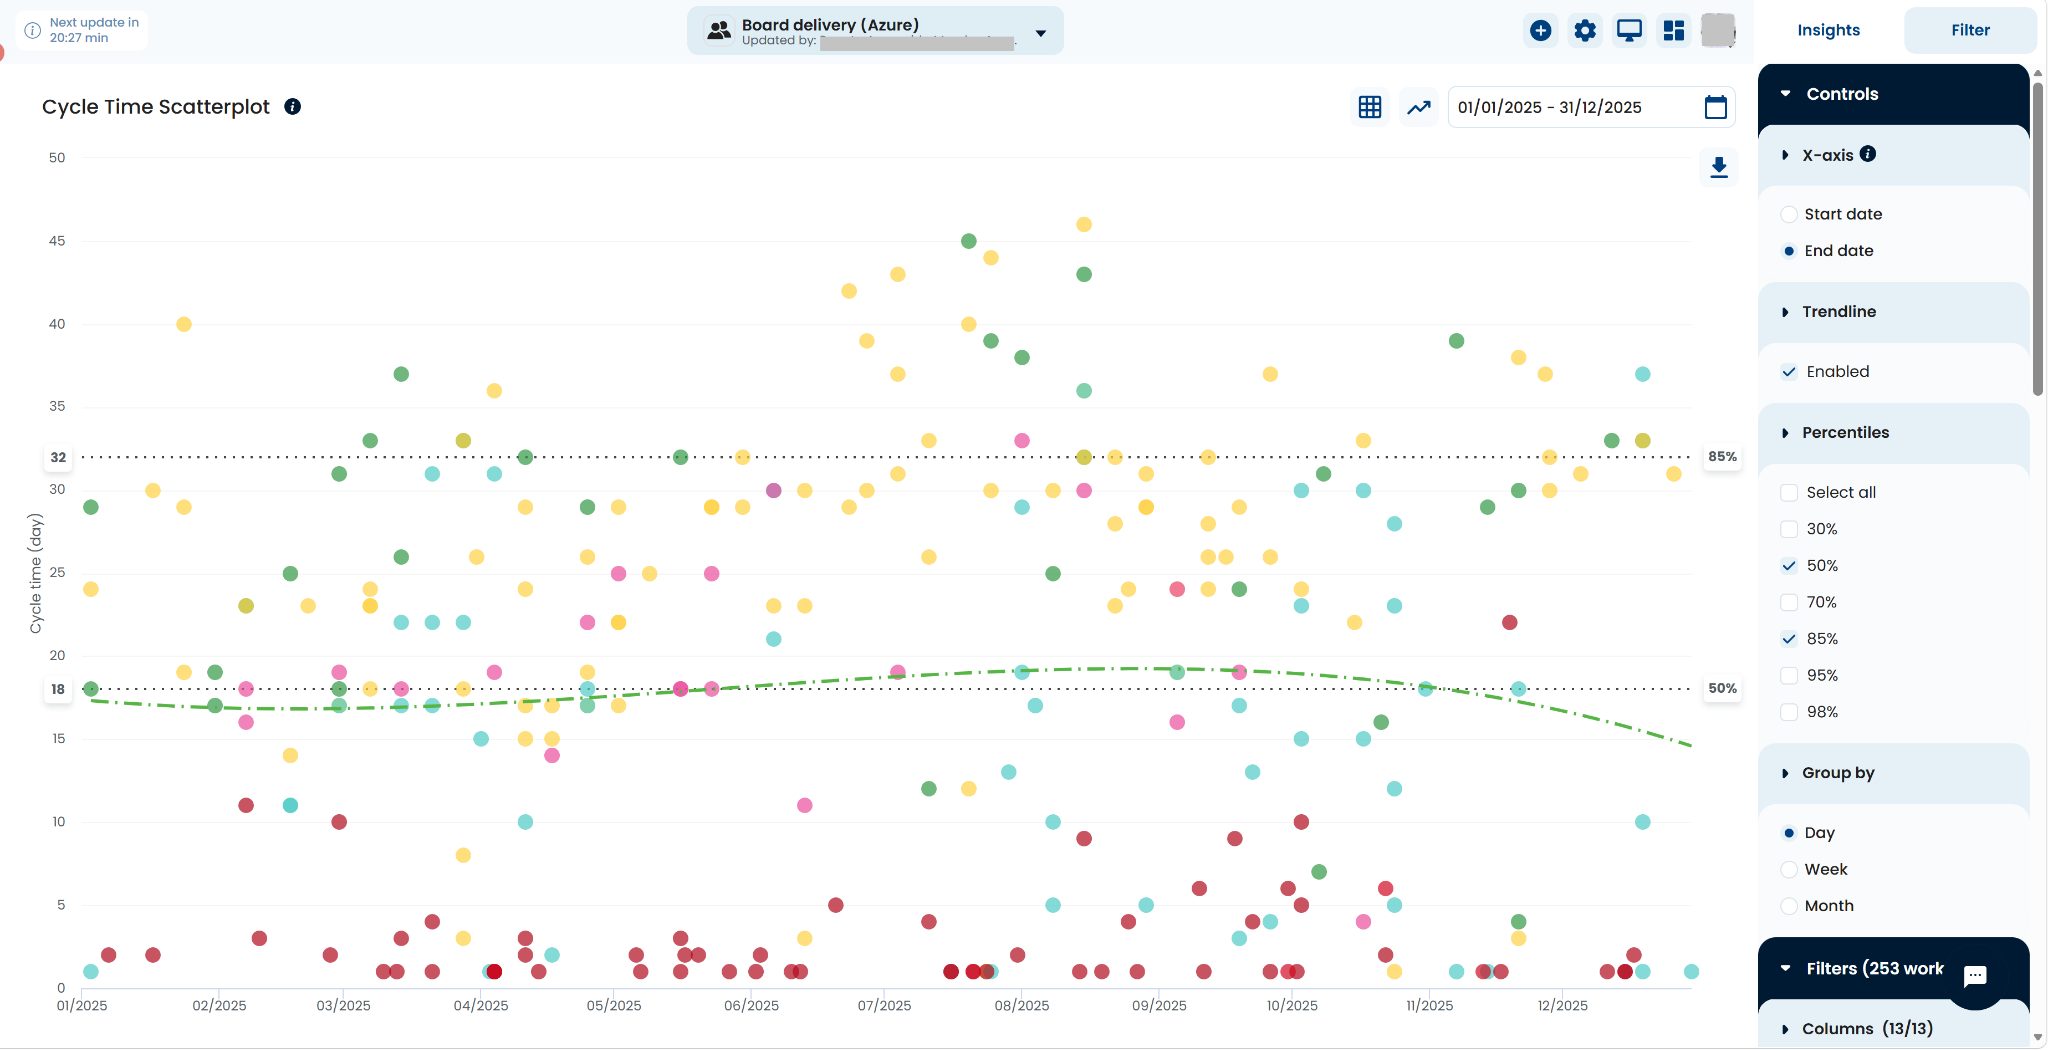
Cycle Time Scatterplot, full year 2025: 85% of work items were completed within 32 days, with the 50th percentile at 18 days.
“Because we keep lead time highly predictable, we’re able to inform customer-facing teams of the release date for features or bug fixes with high accuracy.”
That predictability has to coexist with a high delivery rate. Stoque’s Cumulative Flow Diagram for 2025 contains 467 work items and shows delivery continuing steadily throughout the year.
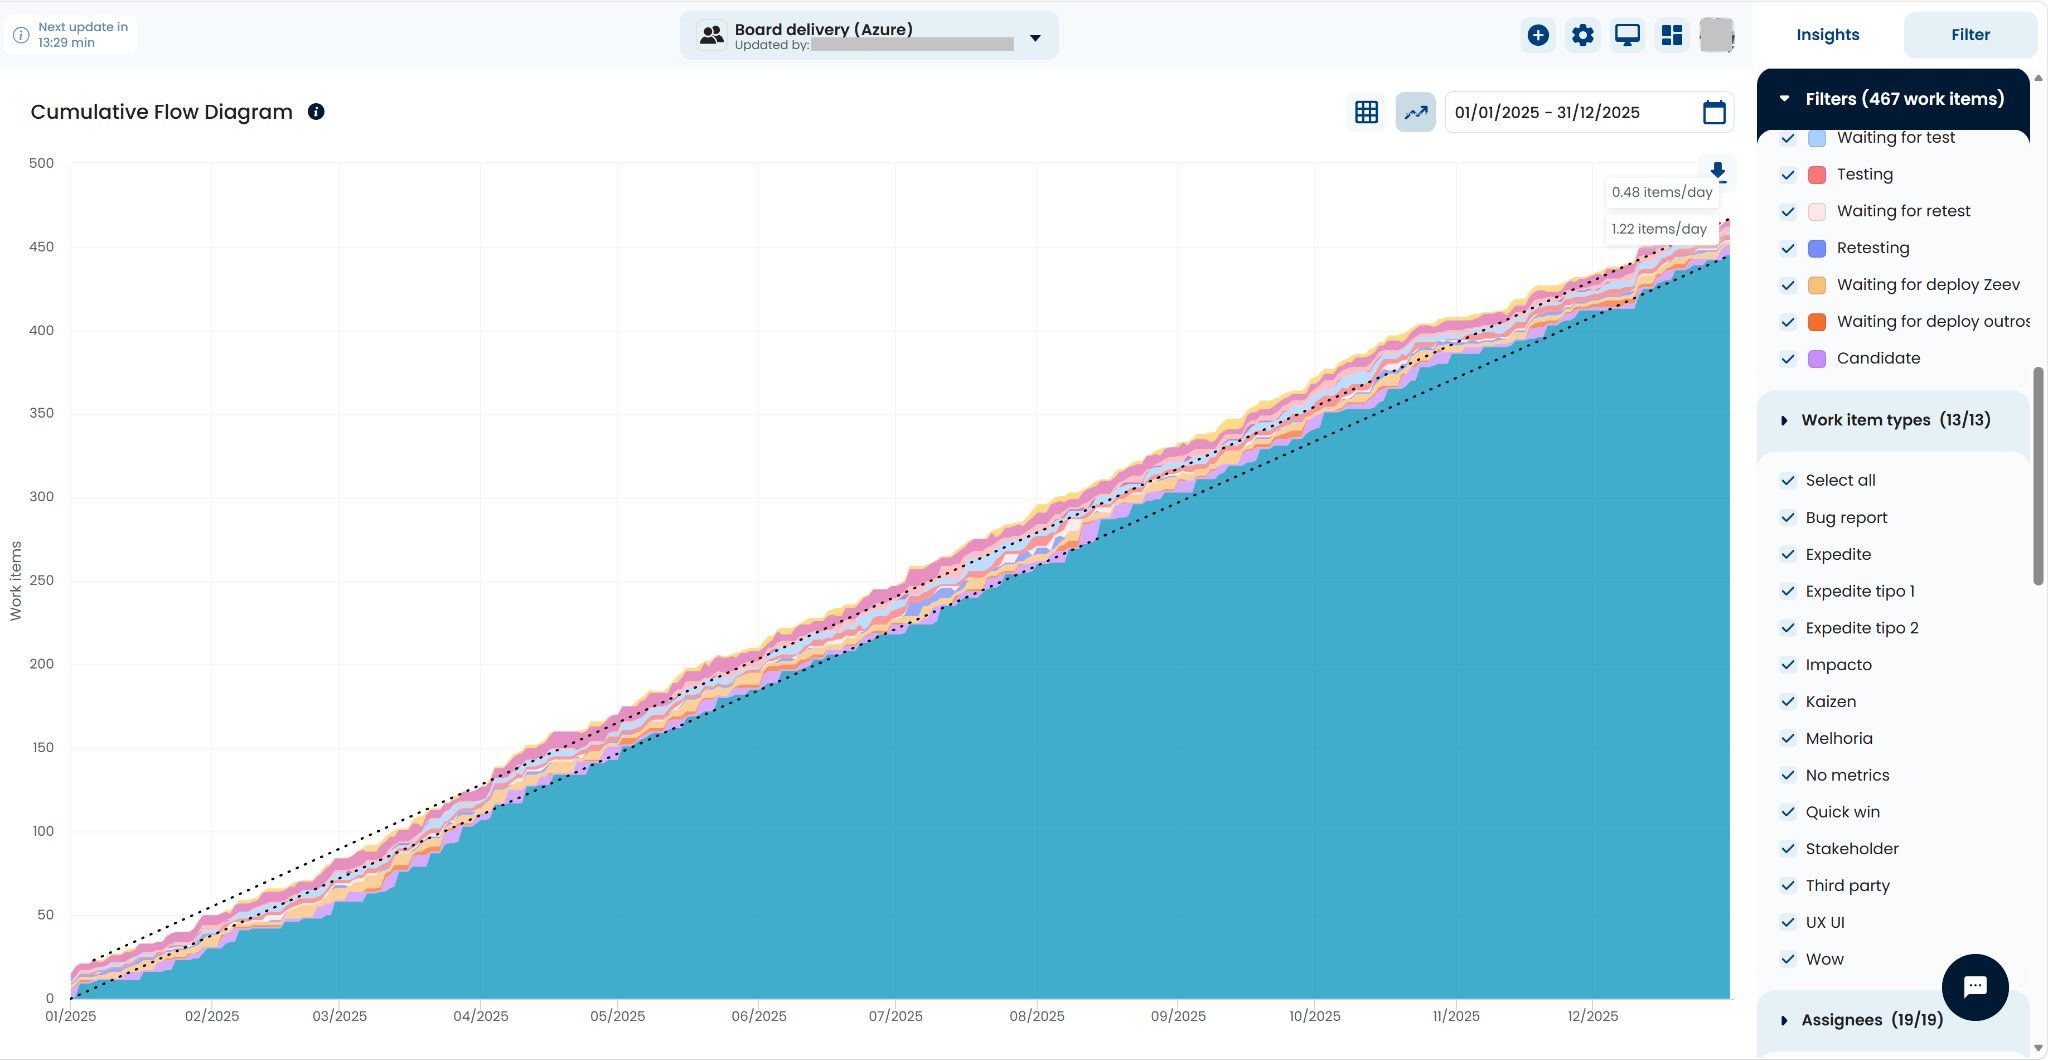
Cumulative Flow Diagram, full year 2025: 467 work items. The chart shows throughput reference values of 0.48 and 1.22 items per day.
For a SaaS product team serving hundreds of customers, that combination matters: maintain a high delivery rate while keeping lead time predictable enough to communicate release dates with confidence.
They Already Knew What Nave Could Show Them
Stoque had already used Nave with Asana before moving its delivery work to Azure DevOps, so the team was not starting from scratch when it made the platform change.
“Because our previous experience with Nave involved using it with Asana, we had no uncertainties about what information it would deliver.”
The work-management platform changed. The metrics the team relied on did not.
“It’s definitely worth it. The software provides all the Kanban metrics we need.”
For Stoque, those metrics now support decisions at several levels: what to unblock today, what to learn from recently delivered work, whether monthly goals are being met, and what delivery date the team can communicate to others.