Tell me if this sounds familiar. You’re sitting in a planning meeting while a new delivery plan is being presented. The dates are on the screen, the report is green and nobody challenges what they’re hearing. The meeting ends and the people presenting the plan leave the room believing everyone is aligned.
But the people closest to the work don’t believe the plan is possible.
When I spoke with Kieran Neeson, founder of Imirt, he told me about watching exactly this happen. Once the people presenting the plan had left, he asked everyone who remained whether they believed it could be delivered.
“Not one person said yes. In fact, the entire room went no.”
So why didn’t anyone say anything during the meeting? Their response was that they would “just brace for impact.” They hadn’t agreed with the plan, but they hadn’t challenged it either. As Kieran pointed out, “But by being silent, you’ve effectively said yes.”
This is where our conversation became really interesting. We normally look at performance data to tell us when a delivery system is starting to struggle. But what if the first warning isn’t visible in your cycle time, throughput or work in progress? What if it appears in the way people behave?
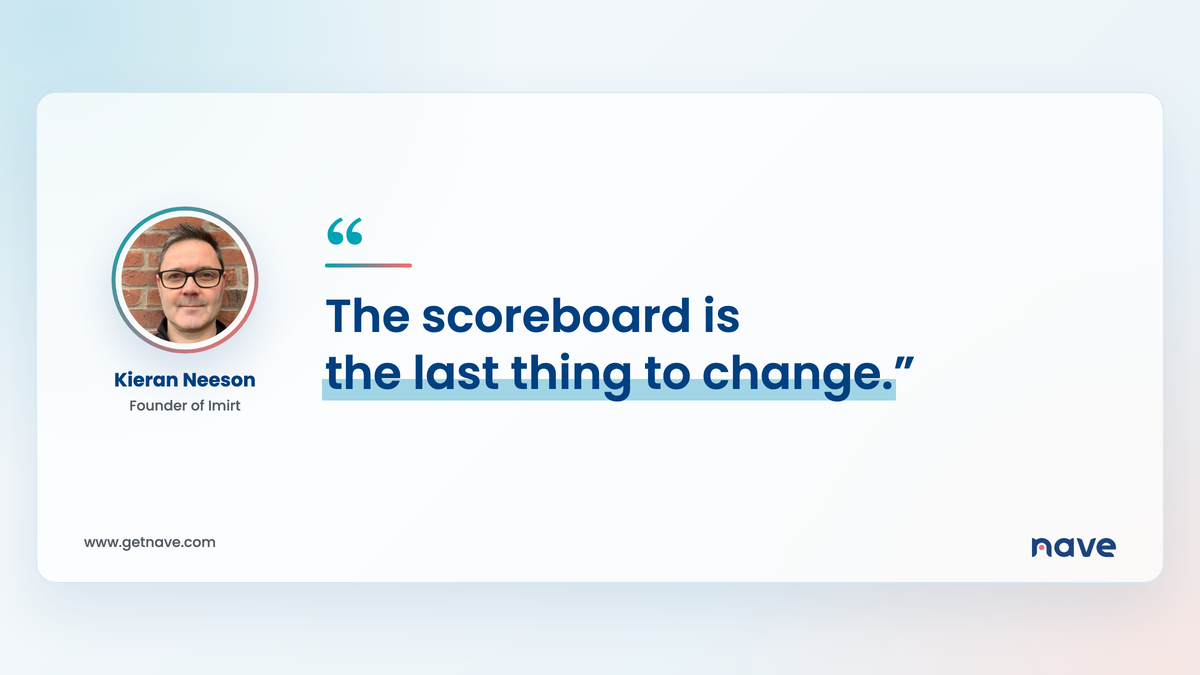
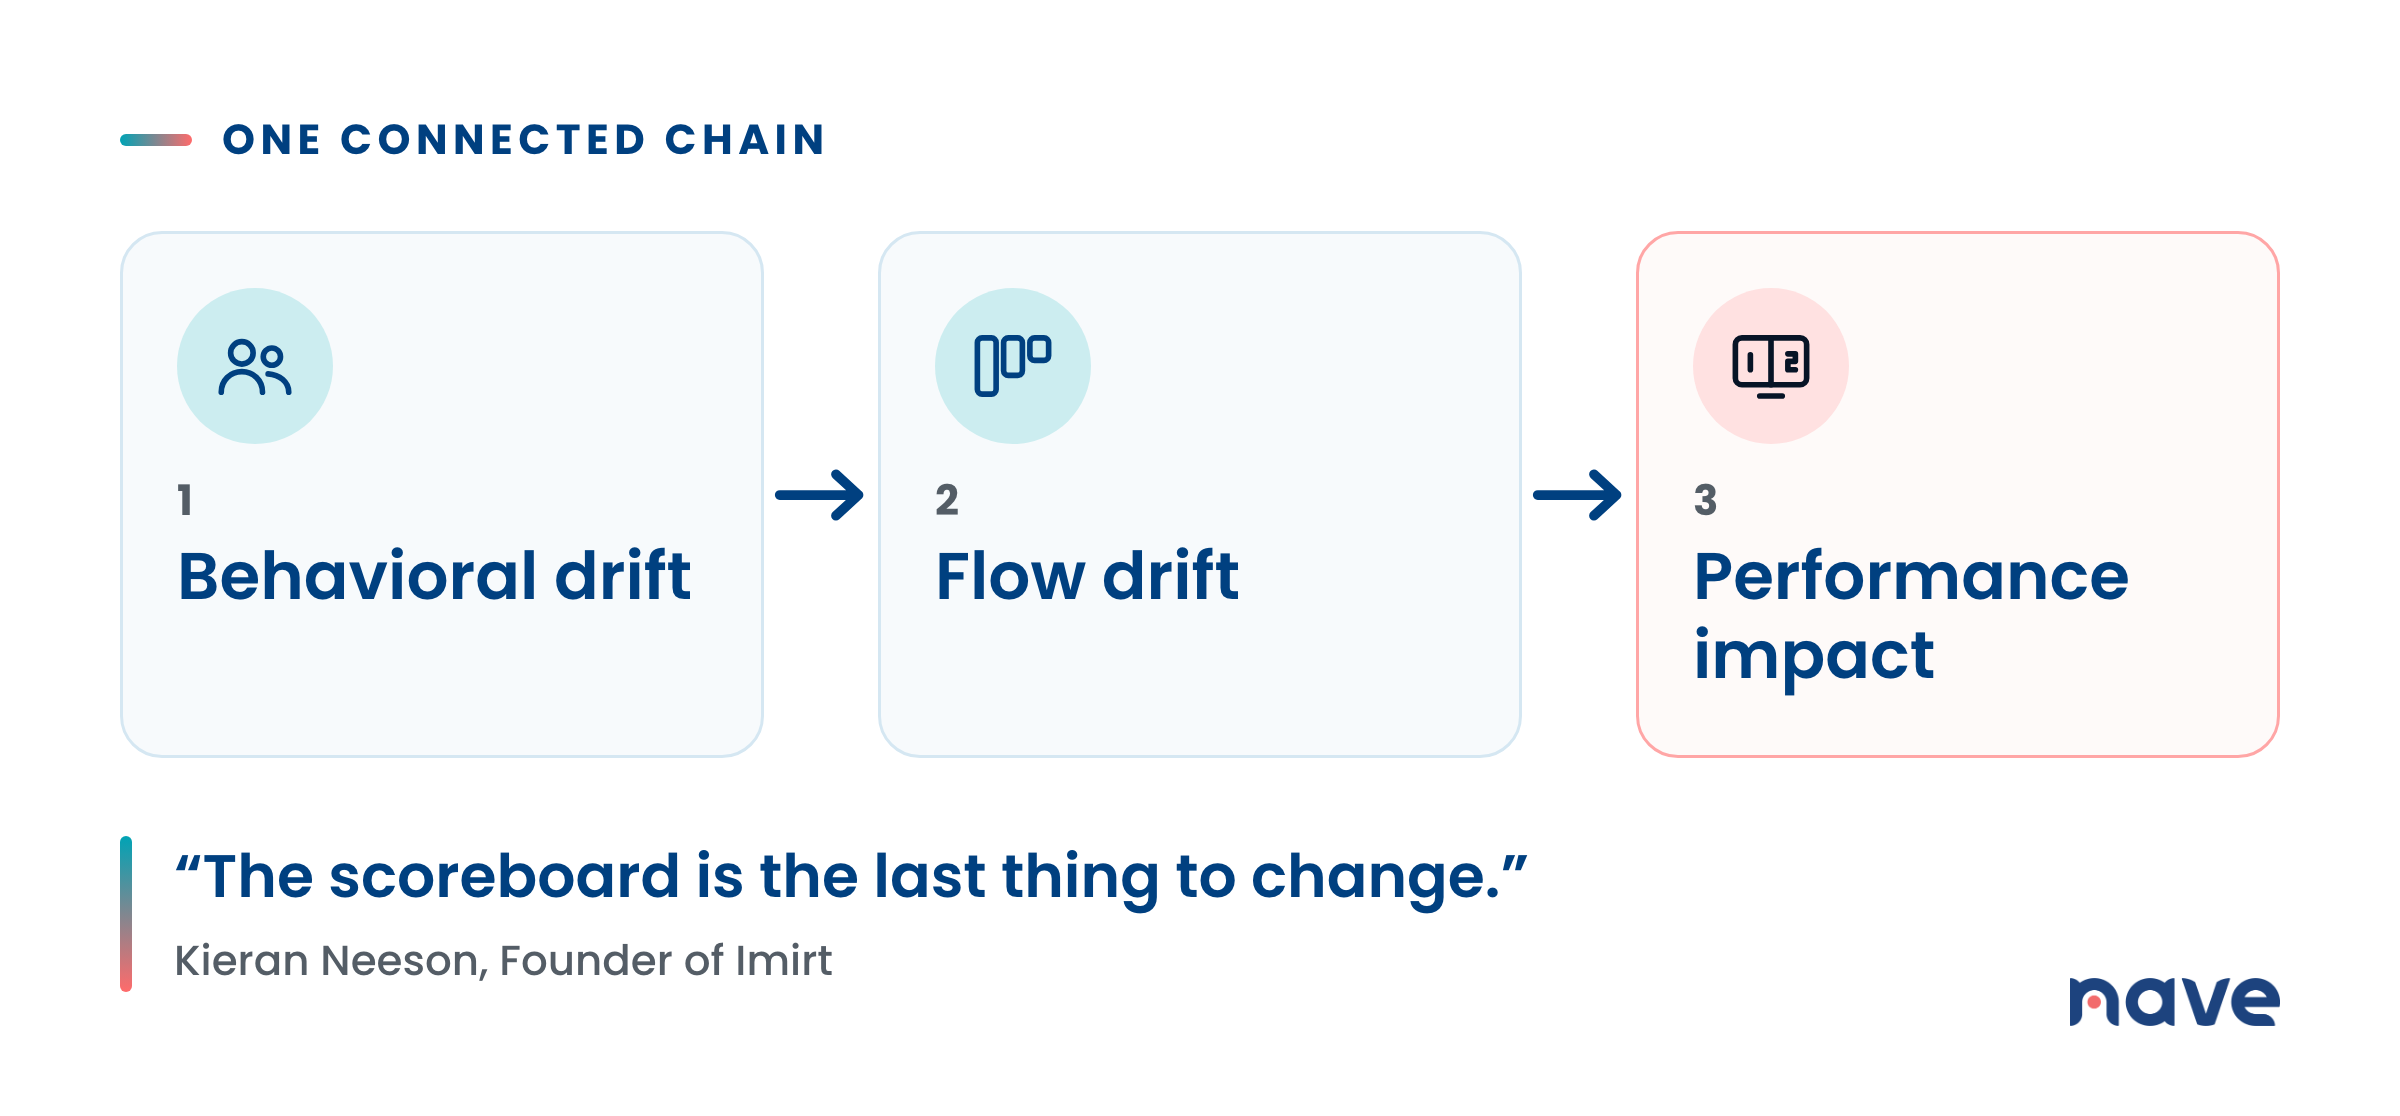
Kieran put it this way: “The scoreboard is the last thing to change.”
When I asked Kieran whether he saw behavioral drift, flow drift and performance impact as one connected chain, he did. The ability to measure flow gives you an important capability, but the earlier opportunity may be to notice the behavior that is about to influence that flow.
Where the Idea of REDs Came From
Imirt is Irish for “play,” and the inspiration behind Kieran’s work came from helping local GAA teams in Ireland on a voluntary basis. While working with sports teams on performance management and analysis, he met former Irish rugby international Bernard Jackman.
During a motivational talk, Jackman introduced a formula that stayed with Kieran: “Performance equals capabilities multiplied by behaviour.”
Kieran was already tracking productivity through the number of scores per possession. He began noticing a strong connection between the teams’ results and specific behaviors, such as giving the ball away. As those behaviors moved the team further away from the result it wanted, they provided an early signal that it was probably heading for a loss.
He started calling these patterns REDs: Recurring Early Drift. Then he began looking for the same kind of early drift in business environments, and the more he looked, the more patterns he found.
The first RED he typically sees is a loss of focus. Perhaps you begin the quarter with five strategic objectives and that number grows to ten. The requirements keep expanding while the work is already underway, or a campaign gradually starts targeting more businesses than originally planned.
At first, this may not look like a performance problem. Your dashboard might still be green and everyone may still believe they can catch up. However, too much work has already been pushed into the system. Eventually, your cycle times and delivery times will expand because you have taken on more commitments than your system can handle.
Your Reports Can Be Green While Your System Is Already Drifting
One of the patterns Kieran describes is “toxic green reporting.” Your delivery reports and executive dashboards remain green until the last possible moment, and then everything suddenly turns red.
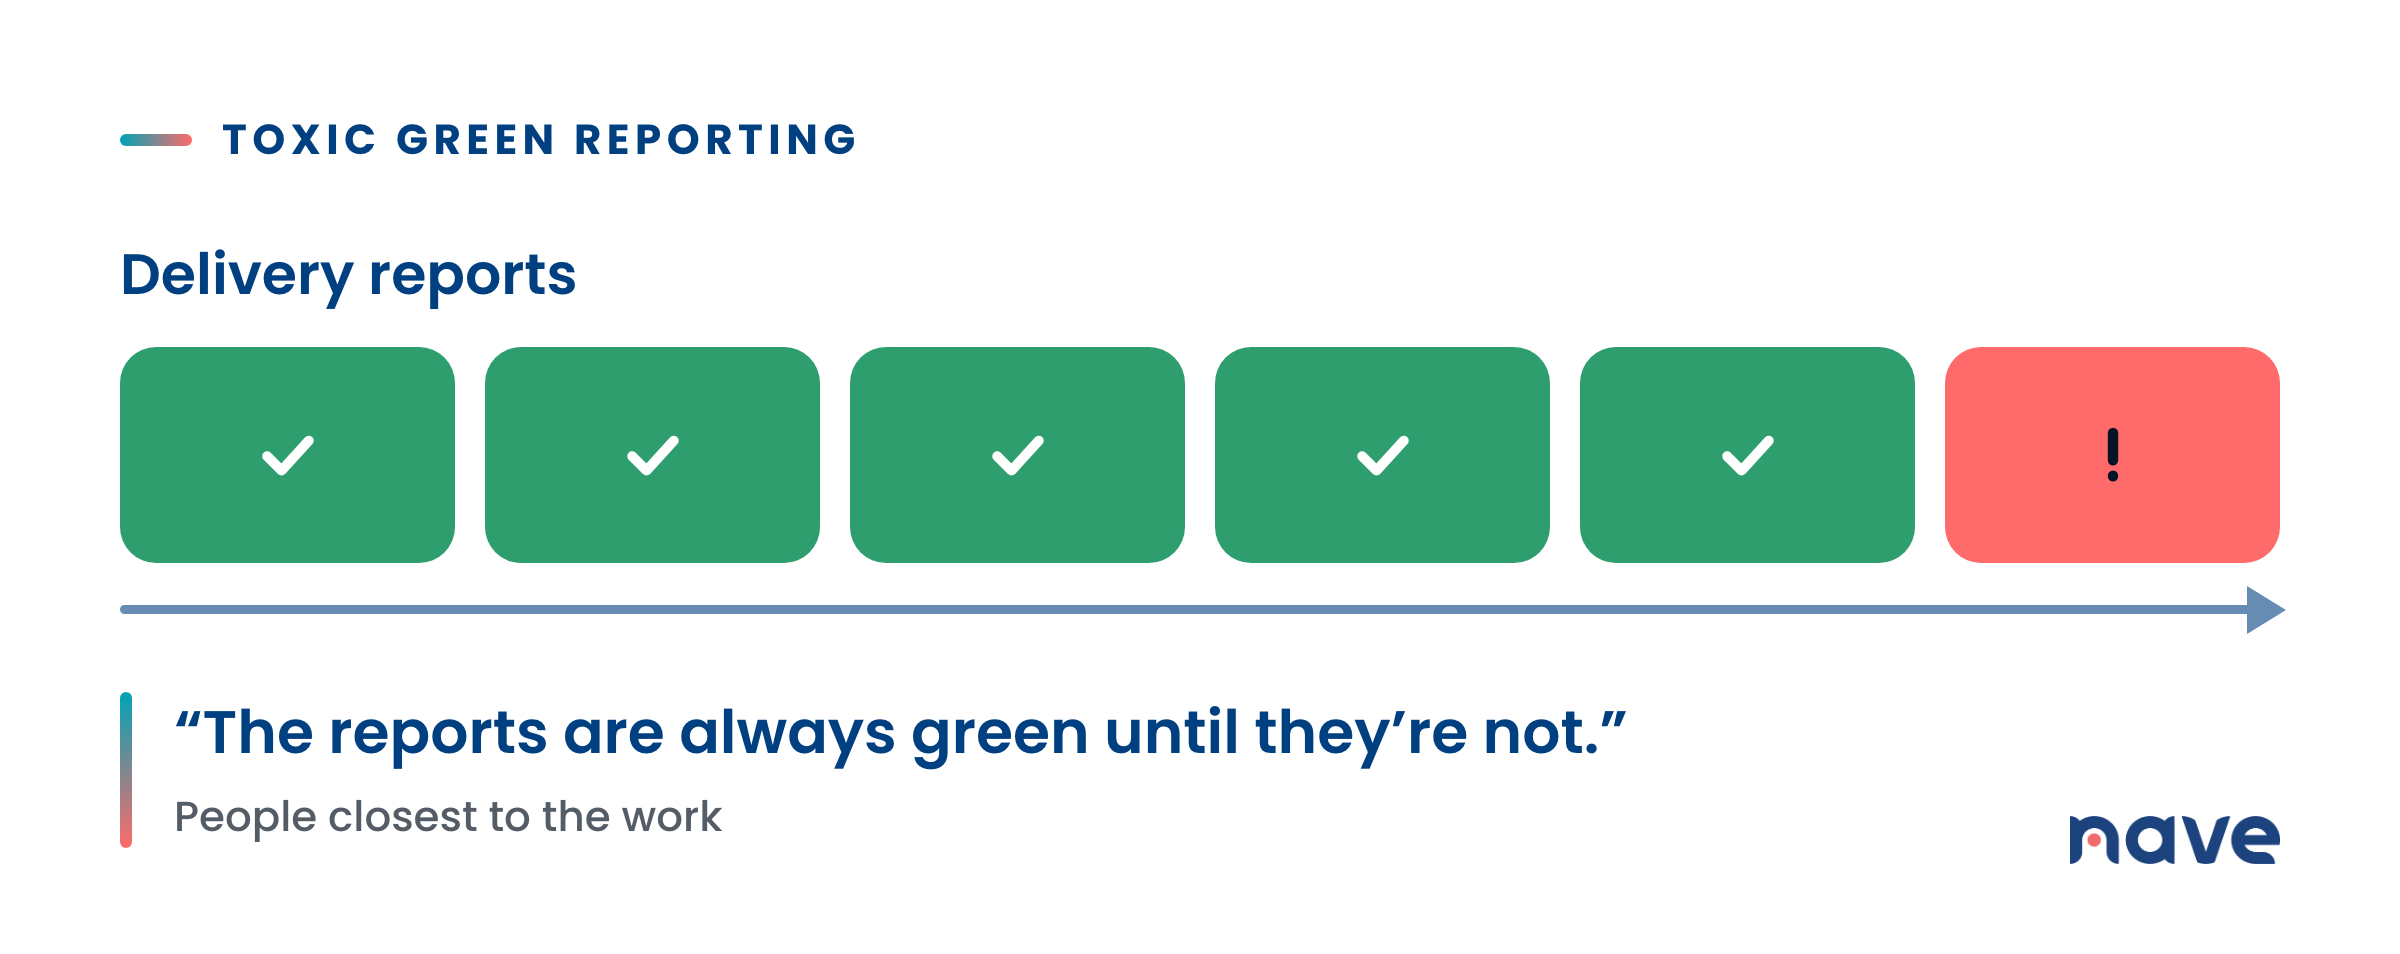
In the example he shared, the reports were always green until they weren’t. Through conversations with people closest to the work, he heard the same concern repeatedly. When he looked deeper, he found that the data behind the reports was closed and inaccessible to most people. It wasn’t clear how the numbers and delivery dates had been calculated.
This was leading to planning far beyond the teams’ capacity and capabilities. Work carried over from one period to the next, new work was added on top of it and the problem continued to grow. Meanwhile, the reports remained green.
Here’s the thing: Your dashboard may not reveal what the people doing the work already know. If they don’t feel safe enough to speak, leadership will continue making decisions based on an incomplete picture.
How to Tell the Difference Between a RED and Normal Noise
Of course, one unusual event doesn’t automatically mean your delivery system is drifting. People will have concerns, plans will change and unexpected things will happen. So, how do you separate a real RED from an isolated incident?
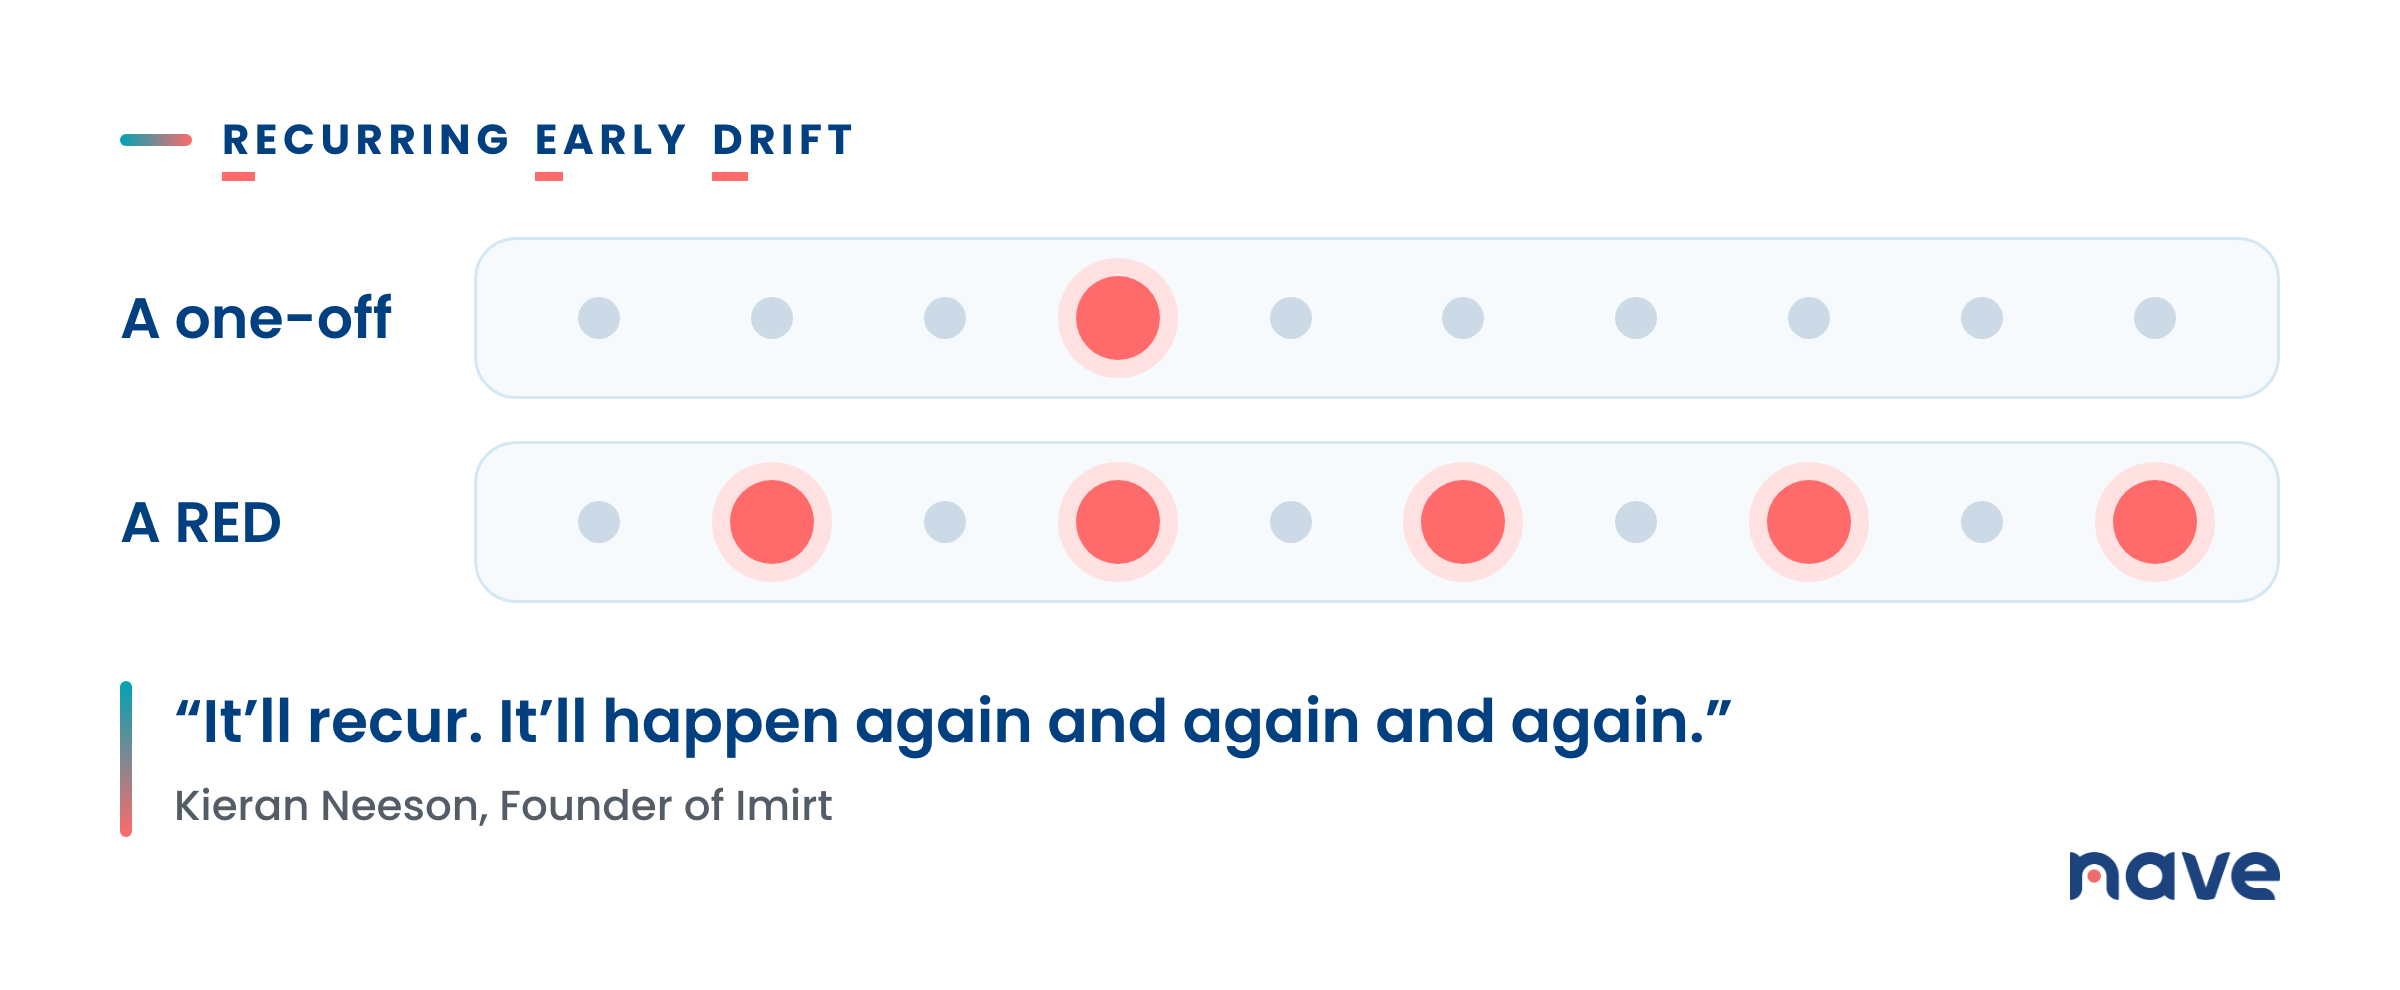
For Kieran, the answer is in the word recurring: “It’ll recur. It’ll happen again and again and again.”
A one-off signal should not be ignored, but a RED reveals itself through repetition. You hear the same concern from different people. You see the same behavior during planning. The same work carries over, the same unrealistic commitment is made and the same additional process is introduced in response.
Finding these patterns starts with a conversation. Kieran typically asks people one specific question: “If you had a magic wand, and you could wave it at one thing, one thing only right now, what would you change?”
I love this question because it forces you to choose. You’re not asking for a long list of everything that could be better. You’re asking people to point to the one thing that matters most to them right now.
The initial evidence may be anecdotal or subjective, and that’s fine. You only need enough information to start investigating. If the same answer keeps appearing in conversations with different people, you probably have a real signal in front of you.
Kieran also encourages people at different levels of the organization to take the REDs test available on the Imirt website. The scores will often differ depending on where people sit because senior leadership and the people closest to the work naturally see different parts of the system.
The goal isn’t to decide which perspective is right and which one is wrong. The opportunity is to make the gap visible and bring those perspectives together.
Don’t Rush to Fix the RED Itself
Once you find a recurring problem, your natural reaction may be to remove it as quickly as possible. Kieran takes a slightly different approach: “I try not to focus too much on the red itself.”
Instead, he looks at the behaviors on either side of it. What keeps happening before the RED appears? What conditions allow it to repeat? What different behavior could interrupt the pattern and produce a better result?
This distinction is important because you don’t want your REDs initiative to turn into another way to point fingers. People’s behavior is influenced by the wider system. If your response is to look for someone to blame, people will become even less willing to surface concerns in the future.
Use Your Flow Data to Stack the Odds in Your Favor
One of the most memorable examples from our conversation involved Kieran walking into a meeting with a betting slip. Inspired by The Big Short, he decided to bet against the delivery plan being presented.
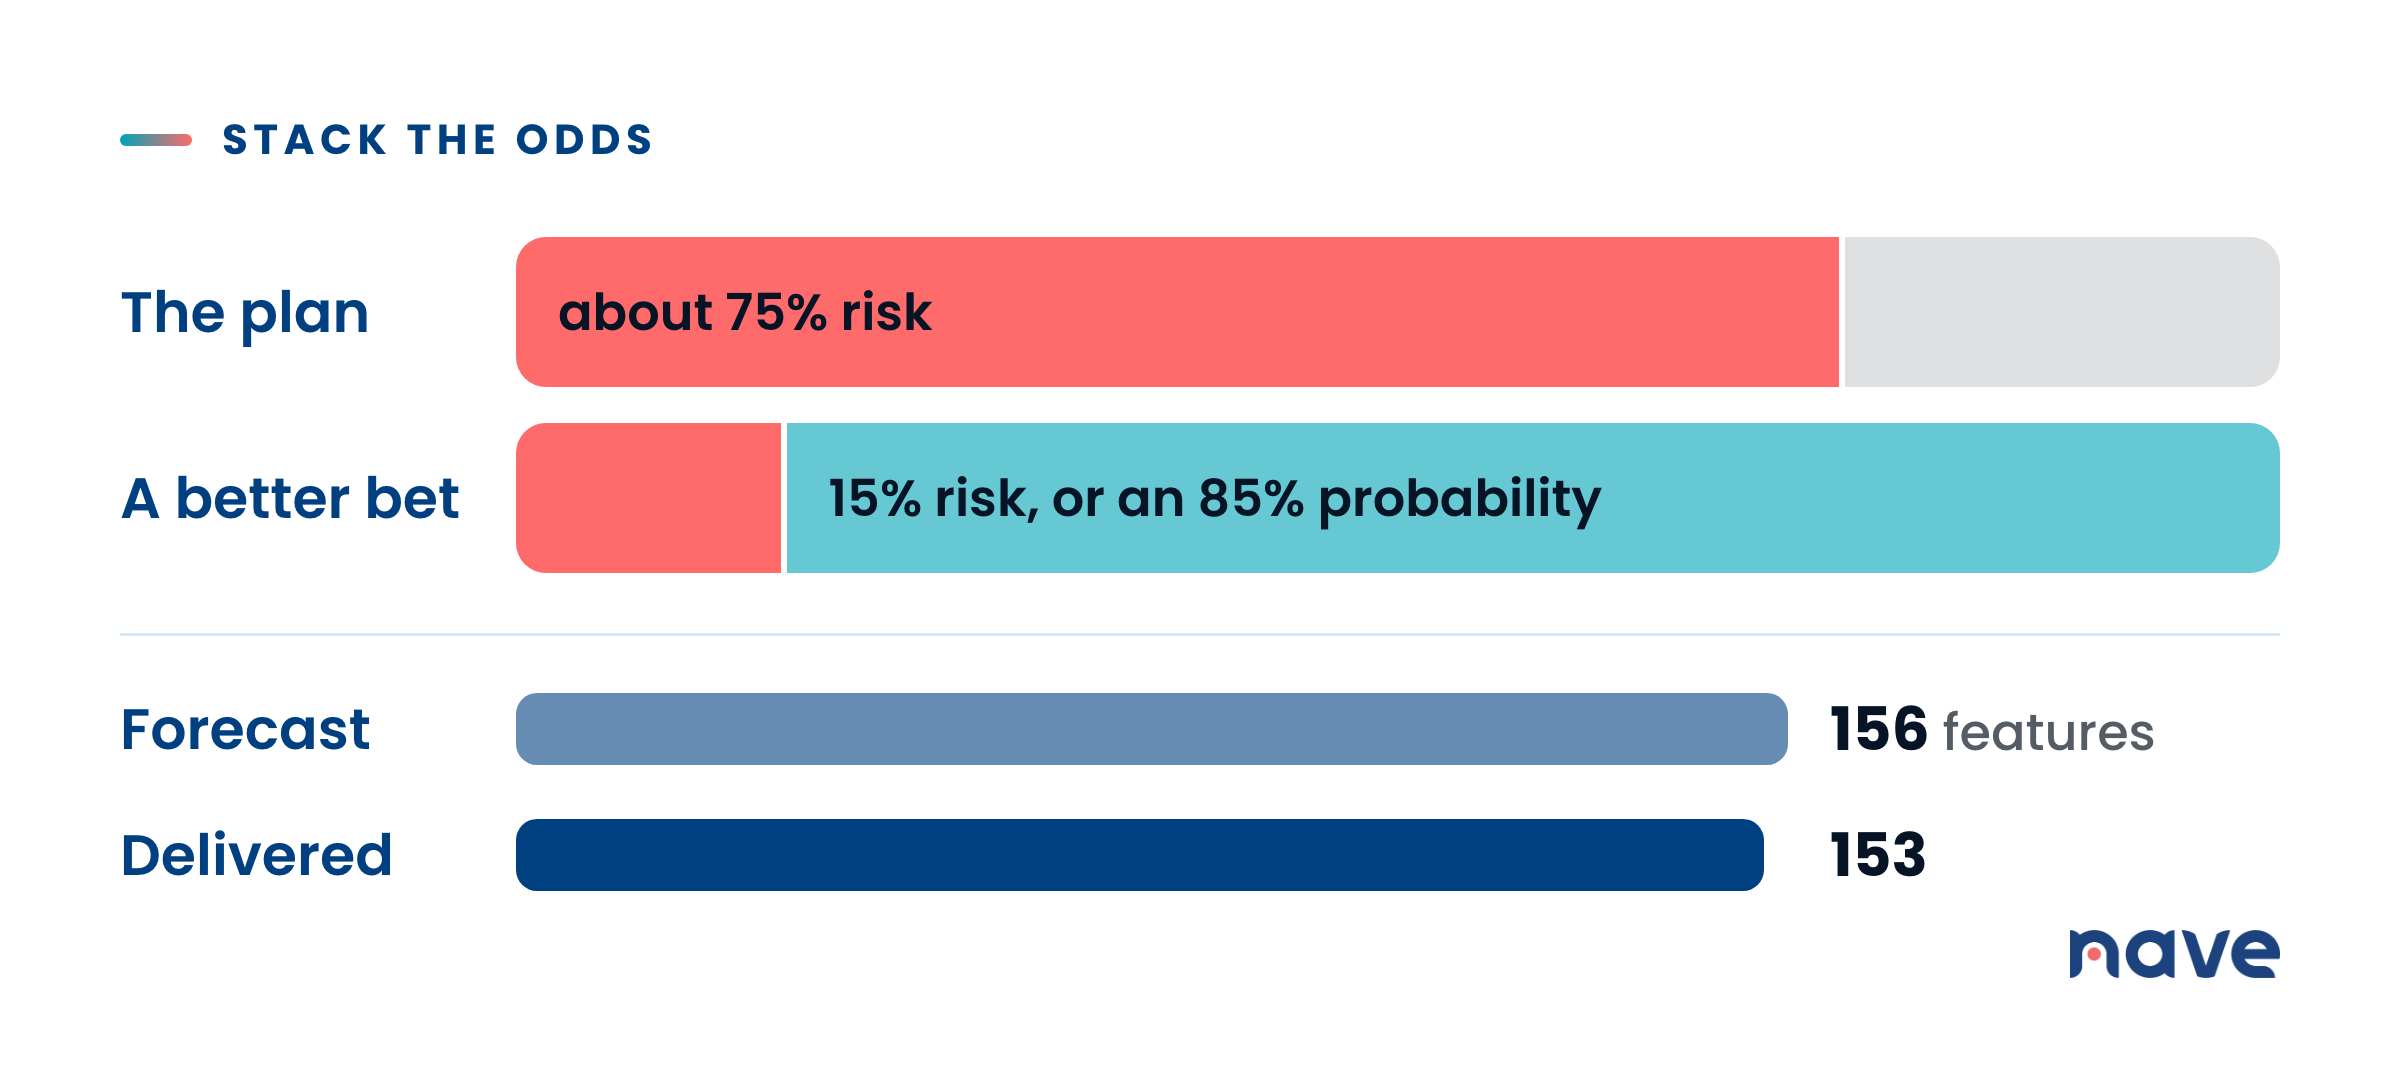
It was certainly an unorthodox way to begin the conversation, but people paid attention. Kieran told them, “The odds of your plan coming in are like four to one.” He then explained, “I can see that you’re carrying about 75% risk.”
Once he had everyone’s attention, the conversation changed. They wanted to know what a better bet would look like.
Using flow and delivery data, Kieran calculated a more responsible number based on 15% risk, or an 85% probability. He forecast 156 features, which was the unit the organization was using to measure its output. At the end of the delivery cycle, they came in at 153.
Now, this doesn’t mean that probabilistic forecasting will give you a perfect answer every time. Kieran was very clear about that: “It’s not about creating a crystal ball and getting the absolute right number. It’s about avoiding the outcomes that you don’t want.”
And this is such an important distinction. Your forecast doesn’t exist to prove that you know exactly what the future will look like. Its purpose is to help you understand the risk involved, avoid irresponsible commitments and make a more informed decision.
What also made Kieran’s forecast credible was that he could show how he had reached the number. The data and assumptions were visible, and people were free to challenge them. Instead of asking everyone to trust another unexplained date, he gave them the evidence behind it.
Data Gives You the Capability, but Your Behavior Determines the Result
Let’s go back to the formula Kieran learned from Bernard Jackman: performance equals capabilities multiplied by behavior.
Measuring flow is a capability. Understanding your cycle time distribution is a capability. Calculating risk and creating probabilistic forecasts are capabilities. However, none of these things will improve your performance if your behavior is to ignore the evidence.
As Kieran put it, “You can have all the flow data that the tools can generate, but if you don’t do anything with it, then nothing’s going to happen.”
This is why detecting REDs and measuring flow belong together. The RED gives you an early signal about the behavior. Your delivery data helps you understand its impact. Then you need to act, observe the result and adjust your course accordingly.
Who should be responsible for finding REDs? According to Kieran, everyone. This shouldn’t become another activity reserved for management, leadership or a specific delivery role.
Creating this culture requires leaders at every level. You need people who are willing to go first, surface an uncomfortable pattern and risk getting it wrong. Senior leaders, in turn, need to make the environment safe enough for people to take that step.
And you don’t build this culture by telling everyone to adopt a new mindset. As Kieran explained, “We don’t just flick on new mindsets. We change our minds and shift our mindsets through action.”
Your First Step Towards Finding the REDs
Here is your action item. At your next planning meeting, review or retrospective, ask everyone the magic wand question: If you had a magic wand, and you could wave it at one thing, one thing only right now, what would you change?
Listen carefully and write down the answers. Then, keep listening over time. Does the same concern appear in other conversations? Have you seen this behavior before? What happens immediately before it? What allows it to continue, and what evidence could help you understand its impact?
Choose one RED and bring the people involved together. Don’t rush into a massive transformation initiative. Introduce one change, observe how it affects your flow and use the feedback from your system to decide what to do next.
The ultimate goal isn’t simply to produce greener dashboards. It’s to create an environment where people trust each other, feel safe enough to speak, take pride in their work and understand how their contribution helps the team achieve its goals.
When I asked Kieran what he would love to see change in organizations, his answer was beautifully simple: “You’ll see happier people.”
You can learn more about Kieran’s work, take the REDs test and explore the evolving playbook at imirt.work.
I wish you a productive day, and I will see you next week, same time and place, for more managerial insights. Bye for now.