Throughput Histogram
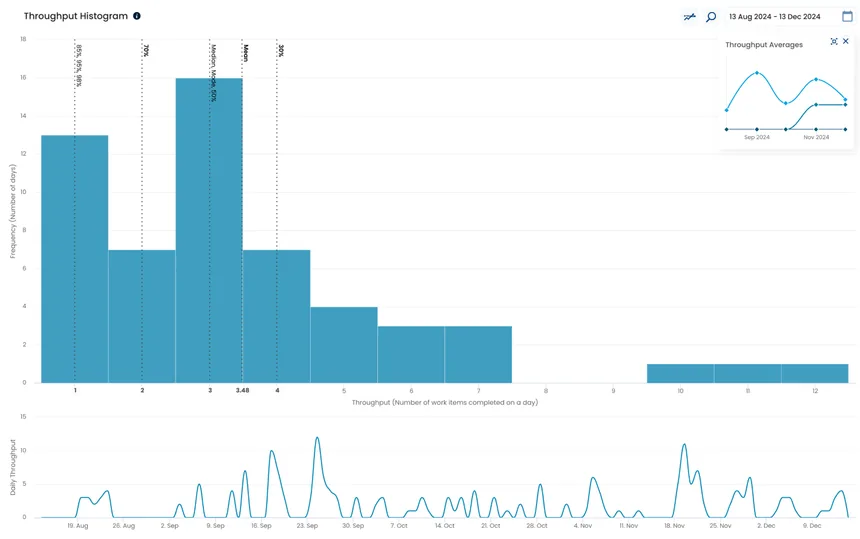
Open the Throughput Histogram to review the past performance data used as a base for Monte Carlo analysis.
What it answers
When will this work be finished?
See when a set of work is likely to be completed and understand the risk of missing a deadline.
Example
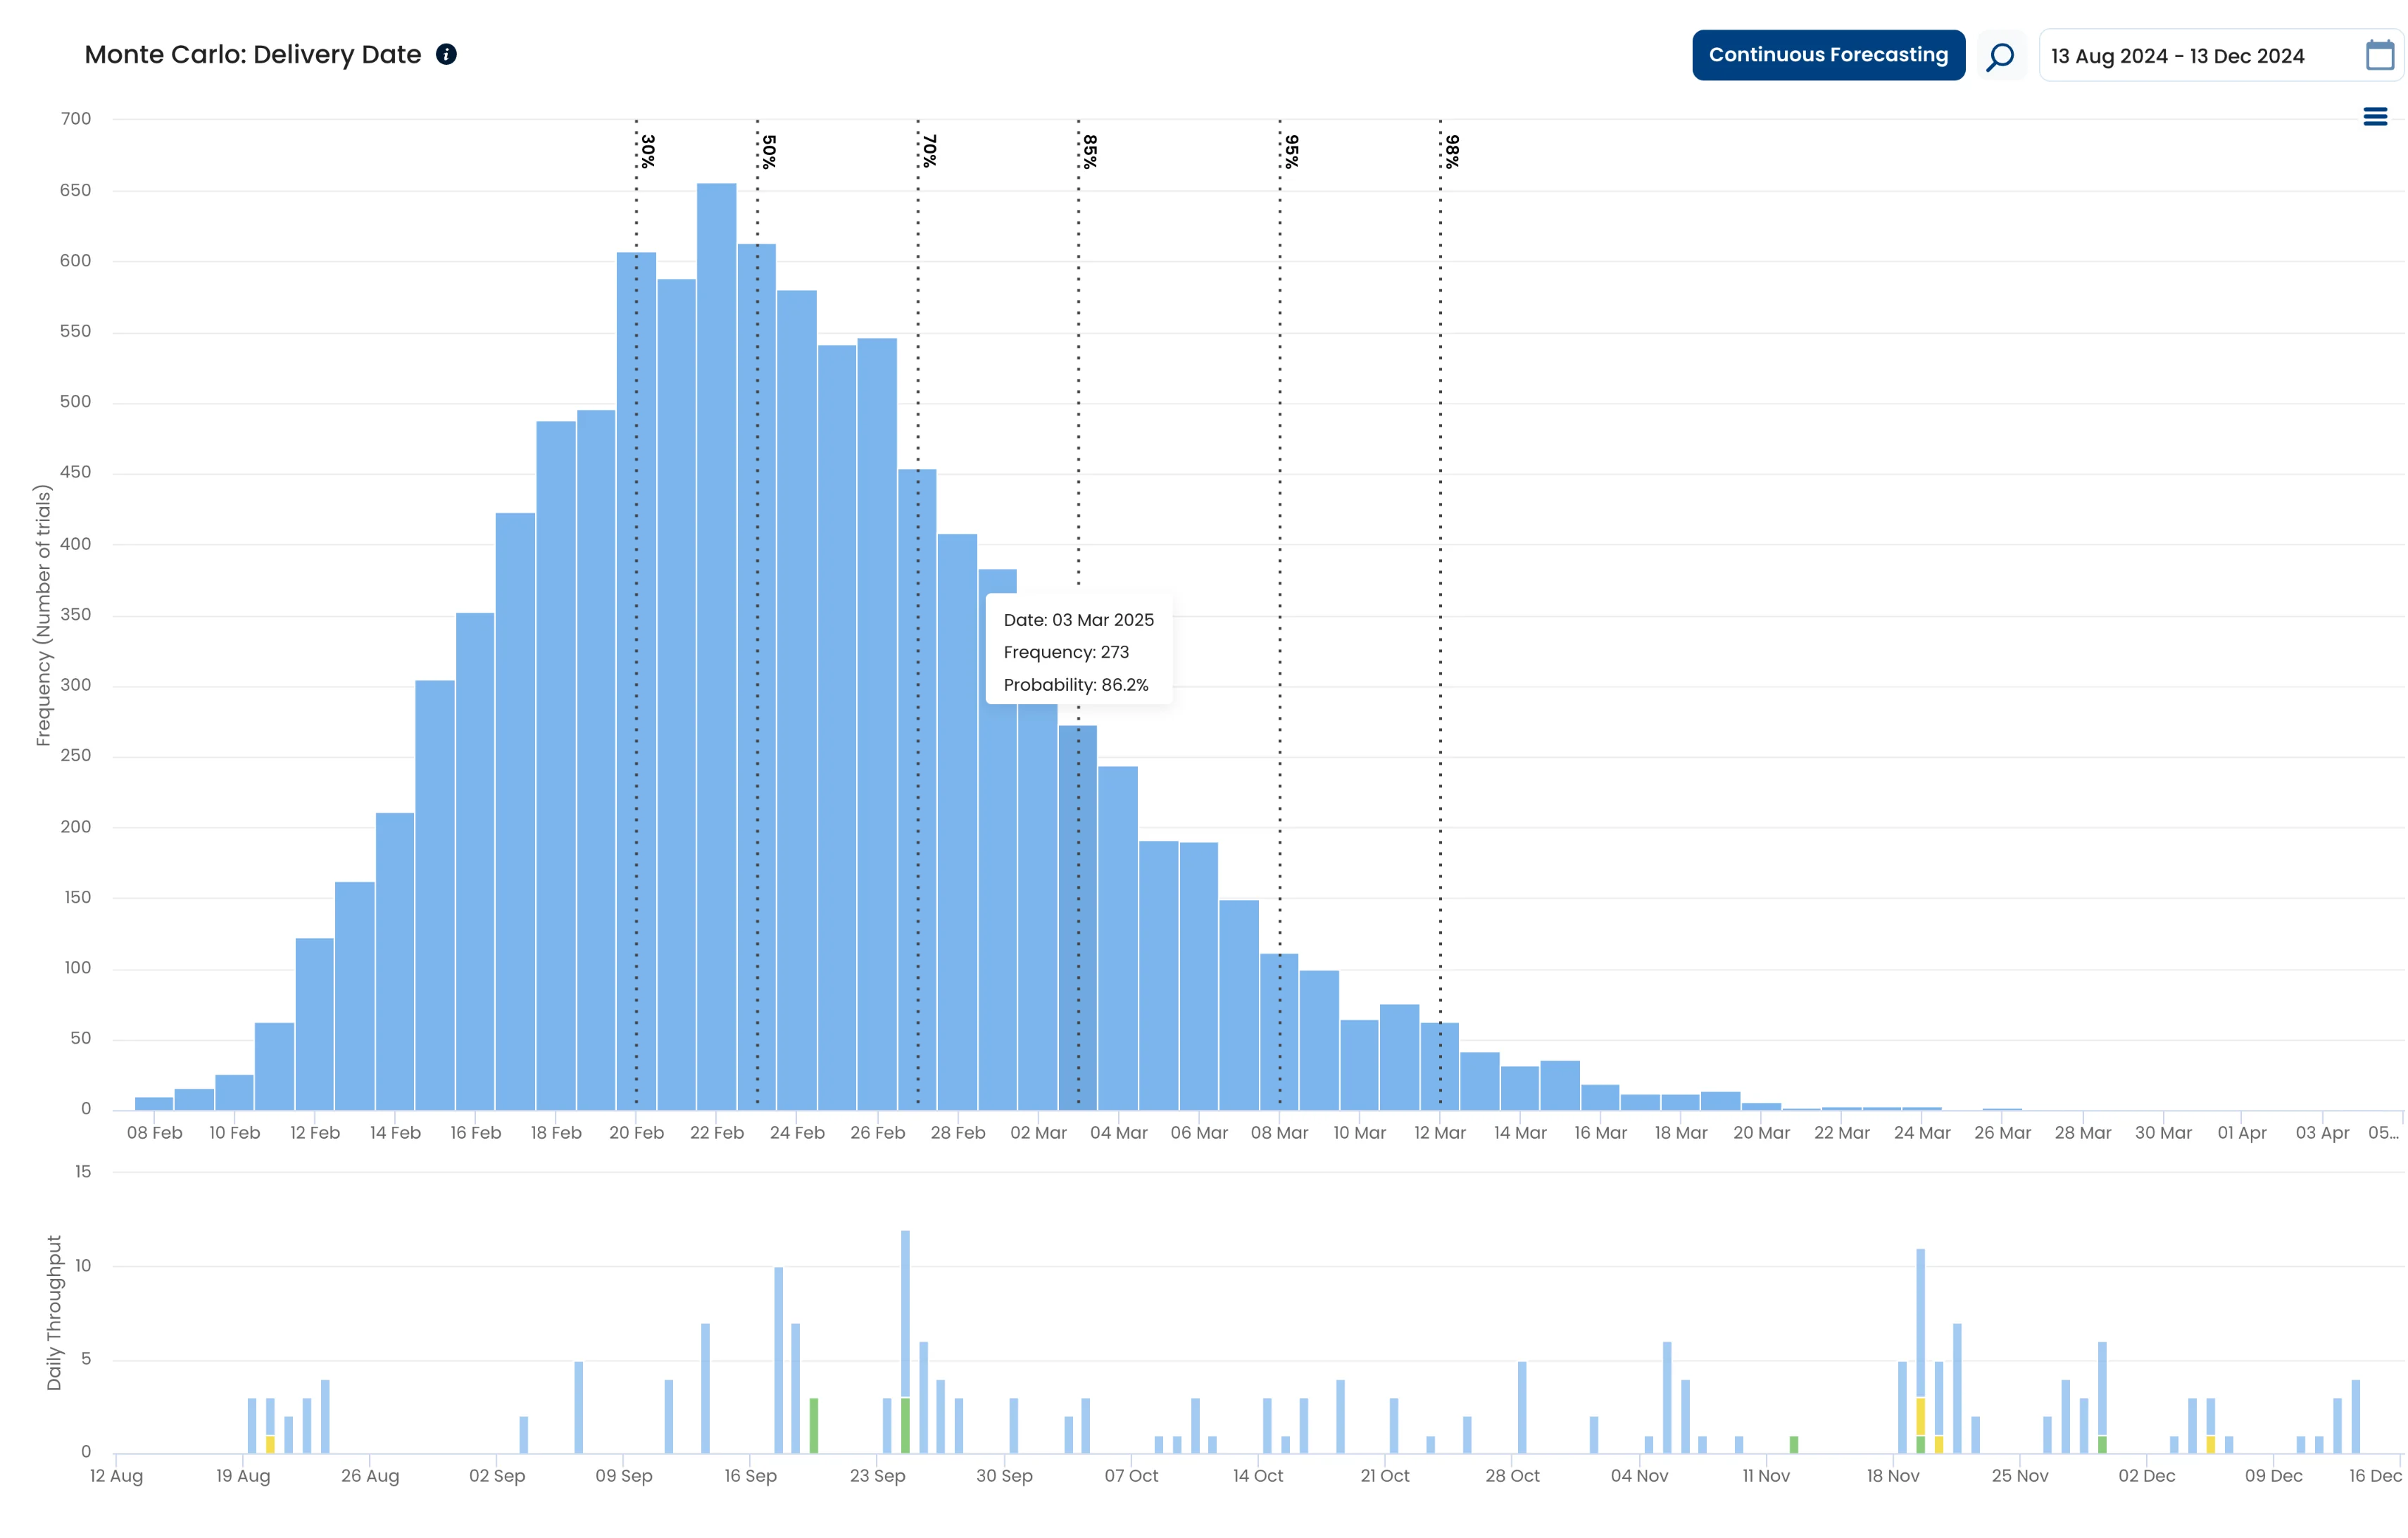
Each bar represents one possible delivery date with an assigned probability. The distribution shows the likelihood of finishing the work on different dates.
A vertical dotted line shows the probability of finishing all the work by a certain date. For example, the 85% line marks the delivery date associated with 85% confidence.
The tooltip identifies a possible delivery date, its frequency, and its assigned probability. The probability shows the likelihood of finishing the work on that date.
The simulation uses past throughput data to generate possible scenarios and predict likely delivery dates.
Monte Carlo: Delivery Date uses past throughput data to generate thousands of possible outcomes. The probability distribution graph shows possible delivery dates and the probability assigned to each date, rather than a single fixed deadline.
Moving further right on the curve gives you more certainty, but also a later delivery date. Compare probability levels such as 70% and 85% to balance speed and confidence.
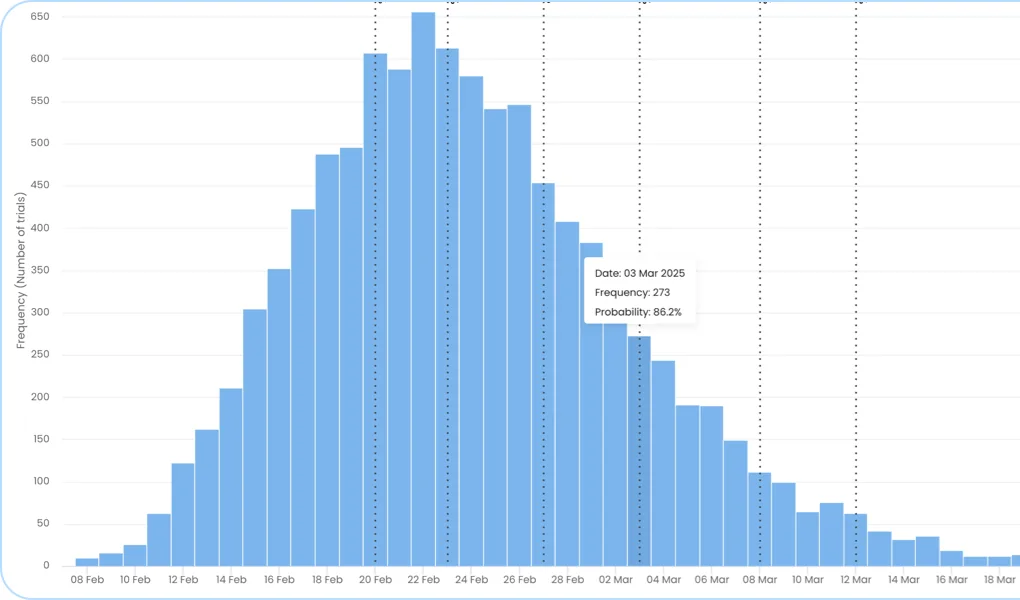
The vertical dotted lines are percentiles. They show the probability of finishing all the work by a certain date, including 30%, 50%, 70%, 85%, and 95%. Use them to compare confidence levels and decide how much risk to take when committing to a delivery date.
For easy work, a stable delivery workflow, and no expected obstacles, use a lower percentile such as 70%. For complex or unfamiliar work with many unknowns, use a higher percentile such as 95% or 98%.
Use the simulation controls to set the start date, number of items to complete, and number of trials. The simulation uses past throughput data to generate possible scenarios and predict the most likely delivery dates.
Save the simulation’s start and end dates and item count in a dashboard view, then use that configuration in a wallboard. Small deviations can occur because the simulation produces different outcomes.
Include new and in-progress tasks in the total count. The simulation predicts how many tasks will be finished by a given date, not which specific tasks will be completed.
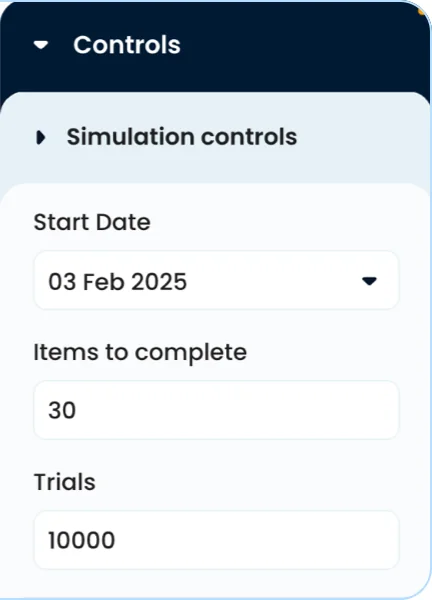
The scale factor adjusts the forecast for expected changes in team performance. Scale throughput down for an expected slowdown, such as holidays or resource constraints, or scale it up for an expected increase in delivery speed, such as after onboarding new team members.
The default scale is 0, so the simulation uses past performance without adjustments.
Use the scale factor only when you expect throughput to change and have no historical data for similar conditions. If past data already reflects those conditions, rely on it instead.
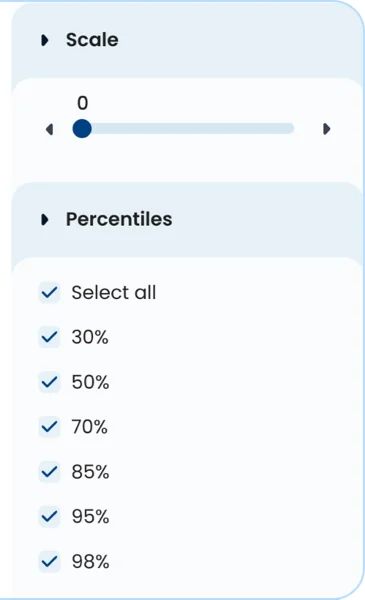
You can export the filtered data shown in this chart as a CSV.
Identify the peak as the most likely delivery date, then compare it with the optimistic and conservative outcomes in the tails.
Investigate whether a delivery date at the 50th percentile provides enough confidence, since that confidence level is comparable to flipping a coin.
Check for expected slowdowns or increases in delivery speed, and whether past data already reflects similar conditions.
Open the Throughput Histogram to review the past performance data used as a base for Monte Carlo analysis.
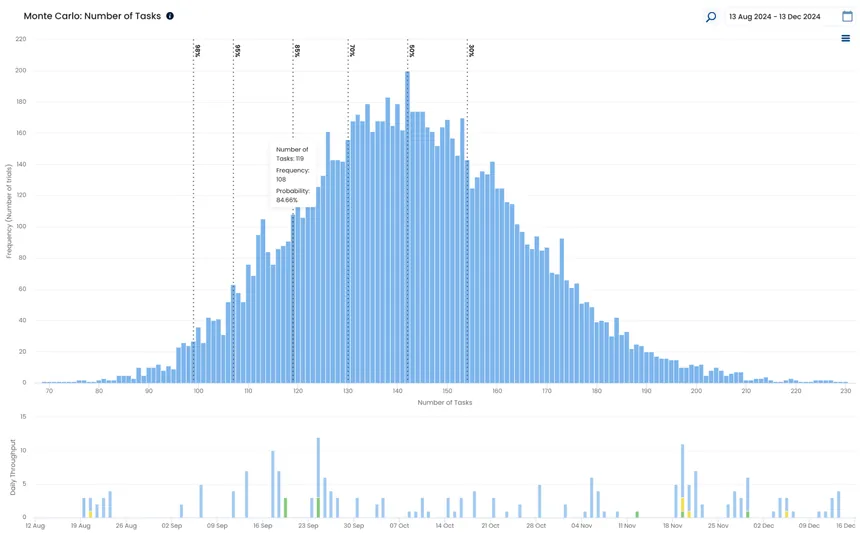
Open Monte Carlo: Number of Tasks when you need to calculate how many tasks may be finished within a given period.
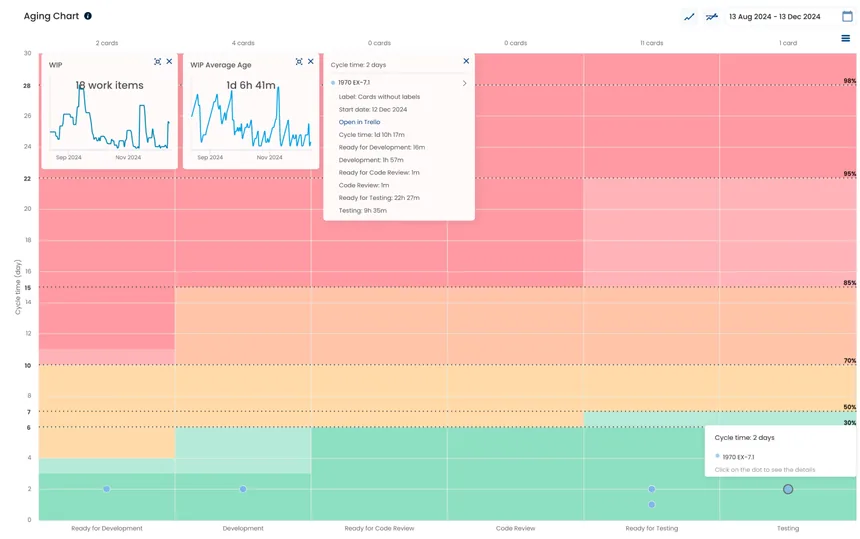
Open the Aging Chart to integrate deadline management into daily meetings alongside delivery-date predictions.
Connect your existing delivery data and start exploring your flow.