
The team looked slow.
Lead Time was 19.8 days. Cycle Time was 13.6 days. In the conversations around the work, the obvious question was why delivery was taking so long.
Then Joelma Castro, Agile Master and Squad Leader, looked at where the time was actually going.
Four days of the Cycle Time were blocked. Another 6.5 days were spent waiting for QA approval. Together, that meant roughly 77% of the item’s Cycle Time was waiting.
The delay wasn’t simply development. It was waiting.
That one piece of evidence changed the conversation. The question stopped being “why is the team taking so long to deliver?” and became “why are our items waiting so long to be approved?”
If your standup keeps circling around why development is slow, this is the question worth stealing: where is the time actually going?
Joelma has a name for what happened next. It is the loop she runs on every team she works with:
Measure → Investigate → Understand → Act → Measure again
Measure
“I don’t use the tool only to track indicators. I use the data as a way to ask questions about the flow, investigate behaviors, and direct improvement actions,” she says. “My goal is not to find a number. It is to understand the behavior of the flow in order to, together with the team, take improvement actions.”
The numbers came straight from the team’s board. Nave’s Cumulative Flow Diagram put the two headline figures on the table: 19.8 days of Lead Time across the full workflow, and 13.6 days of Cycle Time from Ready for Development to Done.
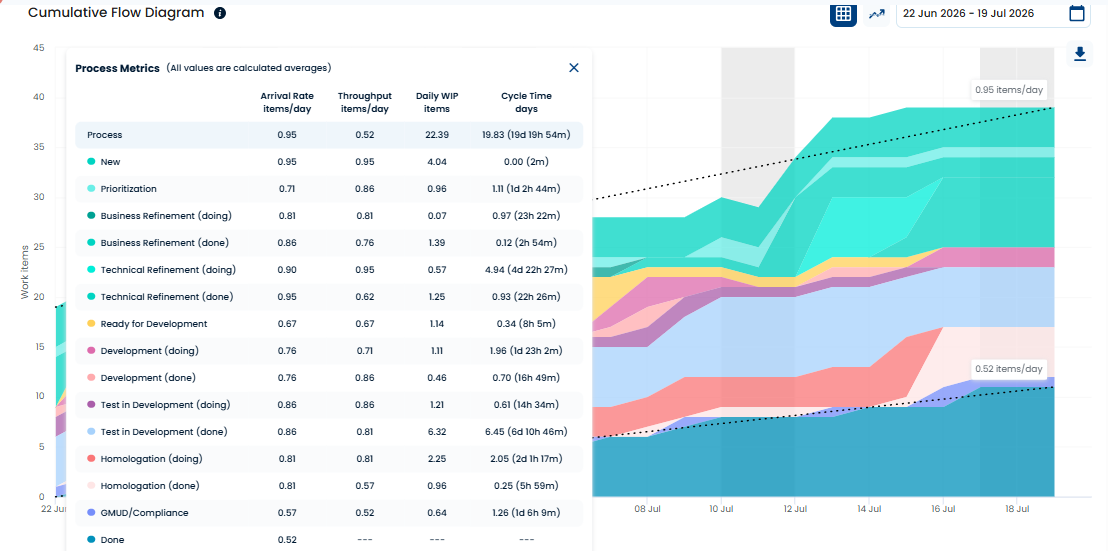
Lead Time across the full workflow: 19.83 days on average.
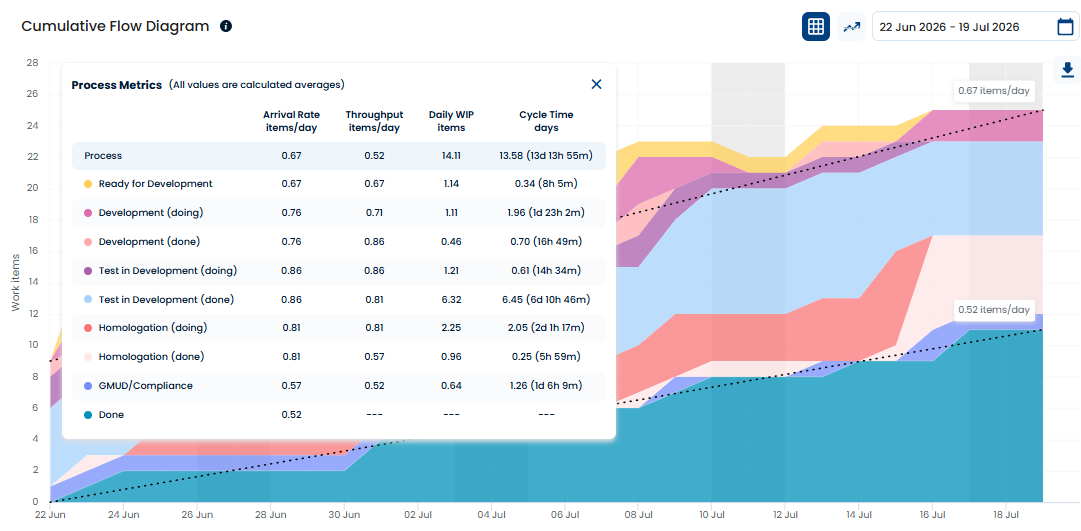
Cycle Time from Ready for Development to Done: 13.58 days on average.
The number that mattered most was hiding one level deeper. Nave’s Cycle Time Breakdown showed where those days were actually going: the single biggest share of the team’s Cycle Time, over 31%, was work that was already developed and tested, sitting in the queue for QA approval. Roughly 6.5 days per item. Blockages accounted for another 4 days.
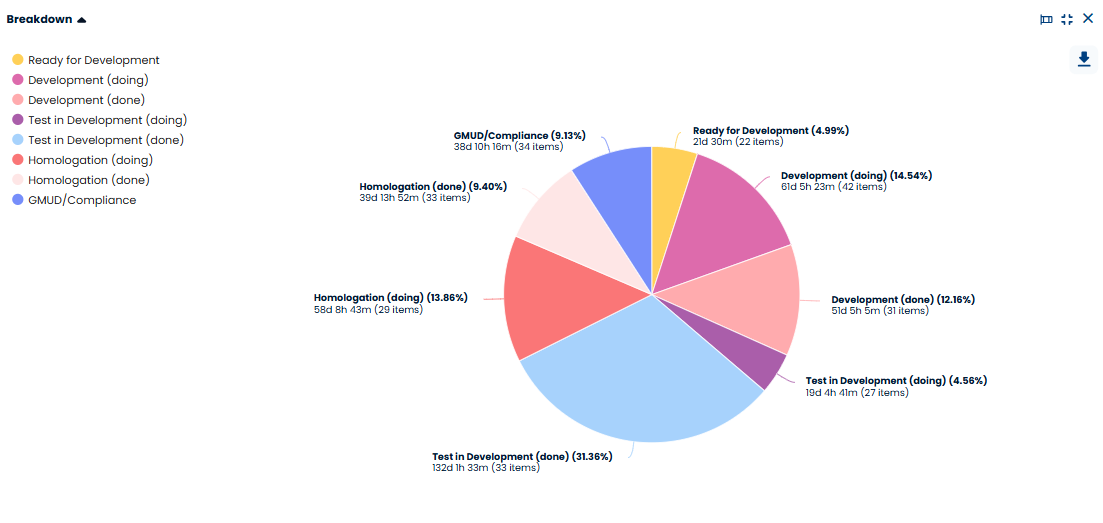
The biggest slice of the team’s Cycle Time, over 31%: items already developed and tested, waiting for QA approval.
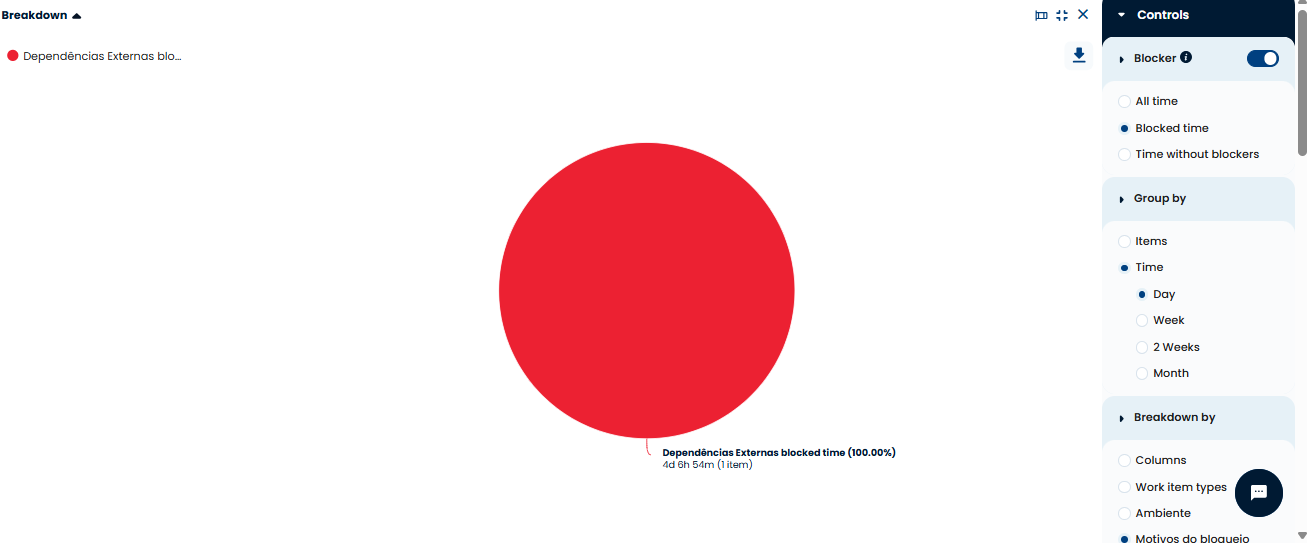
Blocked time: external dependencies accounted for more than 4 days.
A metric on its own is not a diagnosis. It is a signal that tells you where to look next.
Investigate
“When I notice that Cycle Time has increased, for example, I don’t immediately conclude that the team has become less productive. I will investigate,” she says. “Where did this increase happen? At which stage? Which items are driving this result? Is there any pattern among them? Are we talking about an isolated situation or a recurring behavior?”
Once the team stopped treating “development is slow” as the diagnosis, they investigated the flow. They found QA was unavailable at certain times. Emergency work was taking priority. Some items were reaching development without enough refinement. Other conditions were creating blockages before work could reach production.
“The problem, therefore, was not simply ‘development is slow’ or ‘this team is not efficient,'” Joelma says. “There was a bottleneck in the flow.”
Understand
That distinction changes what you do about it.
“If I interpret the problem as low development speed, I will probably look for ways to speed up the developers and may put resources in the wrong part of my flow, making the problem even worse. But if I understand that there is an approval queue and that the team suffers from many blocked items, I need to act on the capacity, the flow, and the conditions that are making the work wait.”
This is where flow data changes the leadership conversation too. There is a huge difference between saying “We need to be faster” and asking “What is making the work wait?” The first puts the responsibility on people. The second invites everyone to investigate the system.
Act
Once the causes were visible, the team could aim its improvement work at the conditions creating the queue and the blockages, not at pushing developers to go faster. Capacity, dependencies, priorities, quality, and the size of demands could all be discussed with evidence instead of perception. The question stopped being “who is causing the delay?” and became “what is making our work stop?”
 | Joelma CastroAgile Master and Squad Leader"I don't believe in using metrics to pressure people. I believe in using data to improve the work system." |
Measure Again
“The last step is as important as the first,” she notes. “After implementing an action, we need to go back to the data to understand whether there really was a change. Otherwise, we run the risk of creating actions based on perception and never knowing whether they worked.”
After the investigation, the team changed how work was refined before it entered development, paying closer attention to dependencies with other teams and to the risks that could delay an item or create a bottleneck later in the flow. They also increased the flow through Homologation (doing), which drained the queue that had been holding the work: Test in Development (done), the same block that had been the single biggest share of Cycle Time. When they measured again across August, on the same scope from Ready for Development to Done, Cycle Time had come down from 13.58 days to 11.61, and Throughput had gone from 0.52 items a day to 1.09. Less waiting, and more than twice as much work finished per day. The approval queue is smaller than it was, and it is still the largest single block in the flow, which is where the next round of improvement starts.
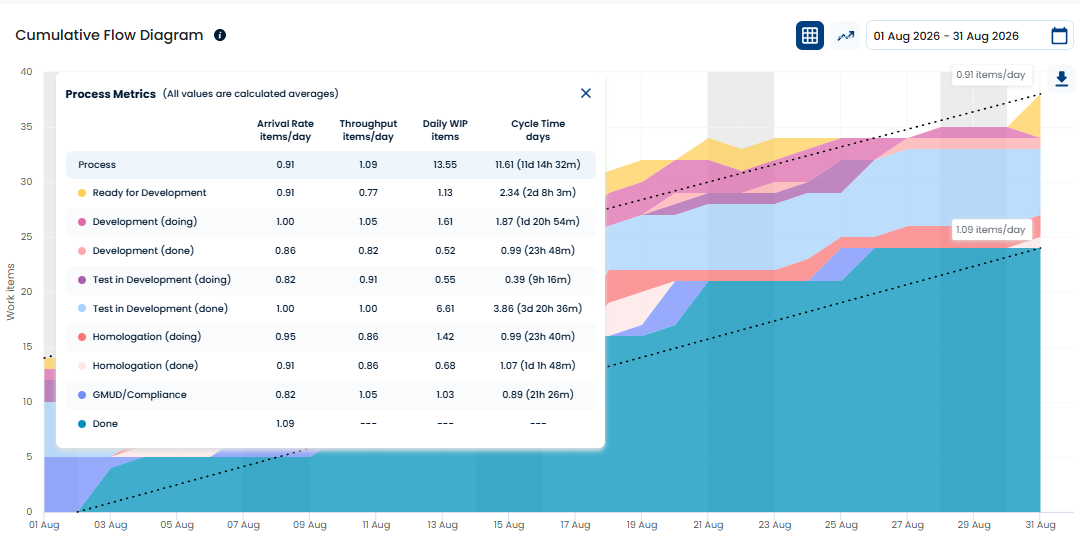
The same workflow measured again across August: Cycle Time down to 11.6 days on average, Throughput at 1.09 items a day.
What to Look at Tomorrow Morning
Pick one item, or one group of items, that feels slow, and look at the elapsed time stage by stage. Don’t start by asking who needs to move faster. Start by separating working time from waiting time.
If most of the time is sitting in a queue, blocked, or waiting for approval, you have a very different problem to solve.
That is where Nave’s Cycle Time Breakdown earns its place: not as another dashboard, but as the fastest way to turn a hunch into a specific investigation.
The Goal Was Never Better Indicators
“This completely changed the game at my company. It allowed us to focus on problems without guesswork. For me, this is one of the greatest contributions of a flow management tool,” Joelma says.
But the most important thing, she stresses, is that the tool does not solve the bottleneck. It helps the team see it. Improvement happens when that information is turned into a conversation, a decision, an experiment, and, later, into new learning.
“In the end, my goal is not to have good indicators,” she says. “It is to use the indicators to build an ever-better workflow.”
Flow data doesn’t replace judgment. It sharpens it. It turns “the team seems slow” into a question you can investigate, an action you can test, and a result you can measure again.
“I’m using this tool and it’s amazing. I can’t work without it anymore.”
I wish you a productive day, and I will see you next week, same time and place, for more managerial insights. Bye for now.


This is a really valuable case study. The Cycle Time Breakdown analysis does a great job of reframing the whole problem, moving the conversation away from “the team is slow” toward the far more useful question of why the work was sitting idle for so long. Nave clearly helped expose a bottleneck that would have stayed invisible otherwise, and the improvement in Cycle Time and Throughput afterward makes that value very concrete.
What stood out most to me, though, is that the tool on its own does not produce these results. It surfaces the signal, but someone still has to interpret it correctly, question the obvious assumptions, and resist the easy reflex of just pushing developers to work faster. That takes a genuinely skilled professional, and Joelma Castro is exactly that kind of leader. Even the best analytics only reach their full potential in the hands of someone capable of asking the right questions. It is leaders like her who turn indicators into decisions and measurable change, and who make it possible not just to meet objectives but to go well beyond them. Excellent tool, excellent analysis, and above all an outstanding professional showing what real flow leadership looks like.
Pedro, this makes me think about how the role of technology is changing. We’re getting to a point where it can put the right evidence in front of us at the right time. But someone still has to turn that evidence into change. A great professional creates the conditions for people to see the problem for themselves, understand why something needs to change and actually want to do something about it. Joelma did exactly that with her teams and I think that’s what made the results possible