Why Industry Benchmarks Don’t Work for Cycle Time (And What to Bring to Leadership Instead)


Sooner or later, every delivery leader gets asked to produce a benchmark. The team’s cycle time is finally on a chart, someone senior leans in, and out comes the question: how do we compare to the industry? Is this number even good?
And I get why it’s asked! We benchmark salaries, cloud costs, conversion rates, so why not delivery? A lone number genuinely gives leadership nothing to work with. Eight days means nothing on its own. They’re asking for a reference point because they need one.
Here’s what I want you to walk away with today: for cycle time, that reference point doesn’t exist, there are two hard reasons why it can’t exist, and there’s a better answer sitting in your own delivery data. By the end of this piece you’ll be able to give it.
Reason #1 No Two Companies Are Measuring the Same Thing
Here’s something most people don’t realize: where you start measuring cycle time is a choice.
One team starts counting the moment a request arrives. Another starts at the point they commit to the work. A third starts when someone actually picks it up. Layer on different work item types, different workflows, and different definitions of done, and two companies both reporting “8 days” are measuring two different things that happen to share a name.
That’s why an industry benchmark for cycle time can never tell you whether one team delivers better than another. It would be a comparison of clock definitions, not delivery performance.
Reason #2 Your Business Only Looks Like Yours
Even if everyone agreed on the definitions, the comparison still wouldn’t help you. Your clients, your teams, your processes, your strengths, your weaknesses, every one of these is unique to you and looks different for each and every company out there. Comparing your cycle time to someone else’s is like comparing your lifestyle to a friend’s just because you’re both the same age. It’s disruptive, irrelevant, and counter-productive.
I choose those three words deliberately. Disruptive, because a benchmark chase pulls your improvement effort toward looking declining instead of getting better. Irrelevant, because nothing about another company’s number transfers to your context. Counter-productive, because the moment a comparison number becomes the goal, your team starts managing the number instead of the flow.
You’re probably thinking, but Sonya, leadership still needs some way to judge the number. You’re right, they do. And the way that works comes from your own board, not from anyone else’s.
What Leadership Is Actually Asking
Here’s the thing: listen to the question behind the question. When someone senior asks how you compare, what they need to know is this: can I rely on this team’s delivery, and is it getting better or worse?
Both of those questions have precise answers in your own data. Two numbers, and you can read both off one chart.
Your trend. Whether cycle time is high or low matters far less than how it moves over time. Watch how the trends build, at least every week. Is your cycle time going down while your throughput goes up? Then the changes you’ve implemented are working, and you can show it. The only time to worry is when a trend is shifting and neither you nor your team knows why.
Your variability. Open the cycle time scatterplot and read two lines off it. On the example below, the 50th percentile sits at 2 days: half of everything finishes within 2 days. The 85th sits at 8: out of every 100 items, 85 come in under 8 days, and 15 take longer. That gap between the lines is your variability. Watching it narrow is watching your delivery become predictable.
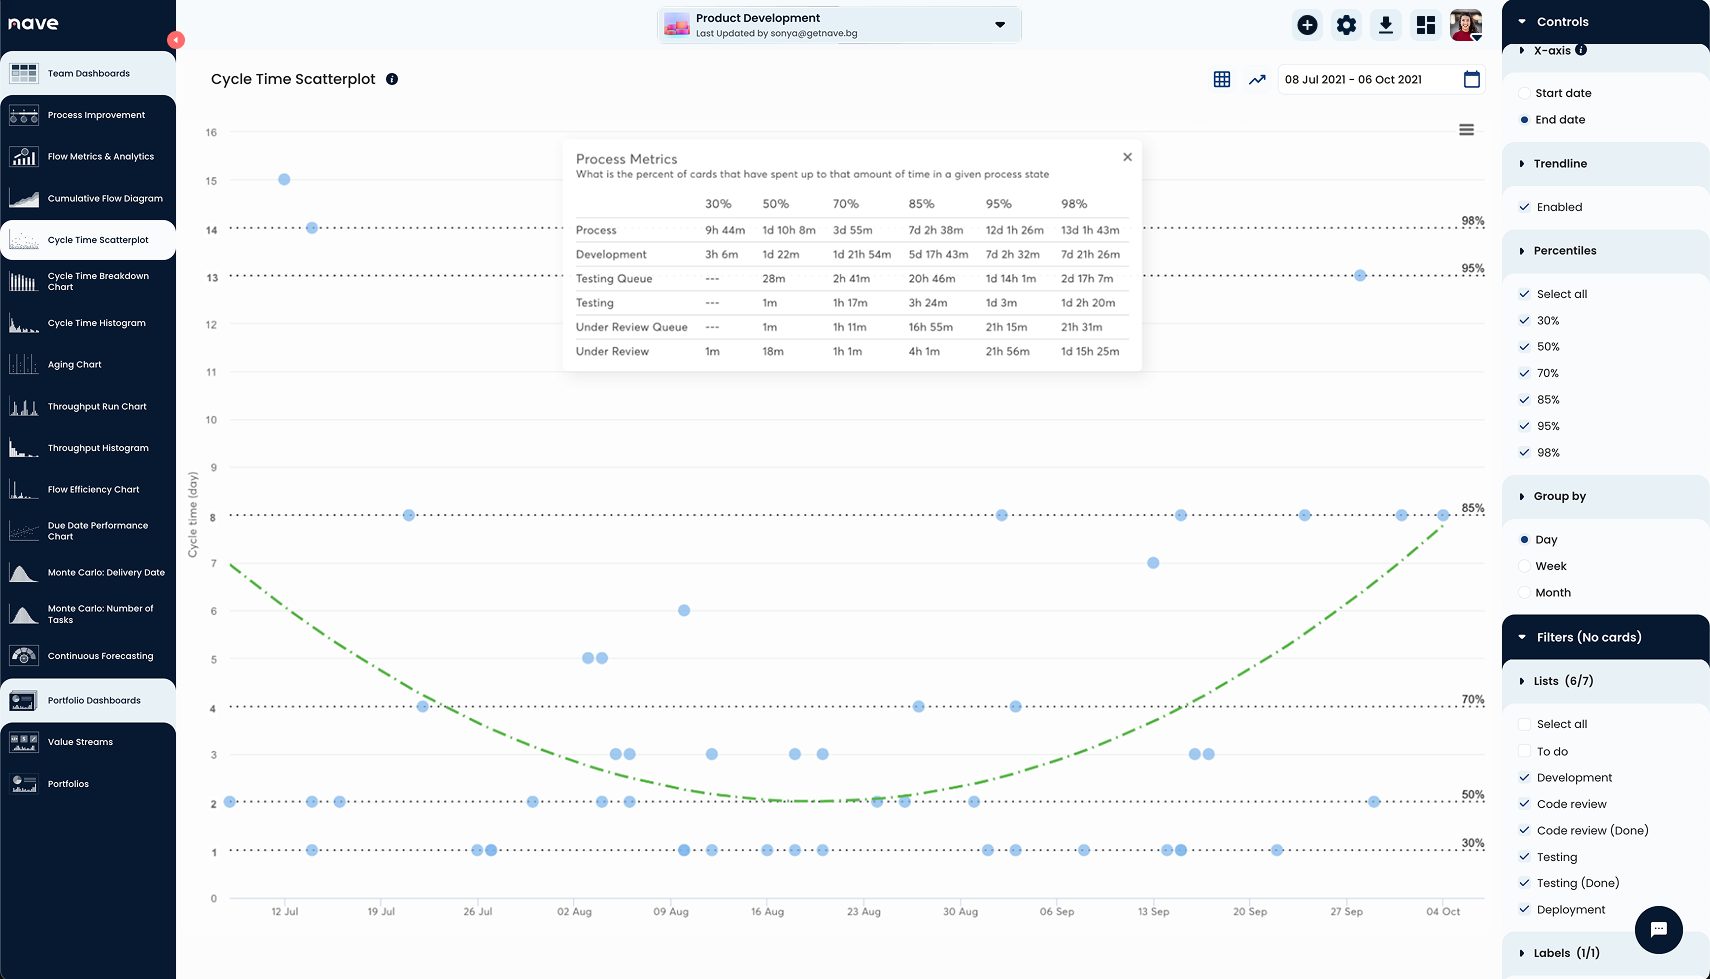
The cycle time scatterplot in Nave. Each dot is a finished item. The 50th percentile line sits at 2 days, the 85th at 8. The gap between them is how much your delivery varies. Learn more at getnave.com.
How to Answer the Benchmark Question
Put together, here’s what you say the next time the benchmark question lands:
Here’s something better than a benchmark: there’s an 85% chance we deliver any item within 8 days, that number has held for the last quarter, and where it moved, we know why.
Does that rank you against anyone? No, it doesn’t. It answers what leadership was actually asking: what they can rely on, and which direction it’s moving. A benchmark would have answered neither.
So this week, before the question comes up again: pull your last 20 to 30 completed items, read your 50th and 85th percentiles, check your trend, and write your version of that sentence with your own numbers in it. Make sure the trend’s direction has an explanation you can say out loud. If it does, you’re ready. If it doesn’t, you’ve just found this week’s actual work, and no benchmark would have shown it to you.
The percentile lines and the trends in this piece come straight out of Nave, calculated with the same validated rules on every chart, so the numbers you bring to that review are numbers you can defend. Learn more at getnave.com.
Leadership doesn’t need to know where you rank. They need to know whether they can trust your next commitment. That’s a question only your own data can answer.
Thanks for tuning in! I’ll see you next week, same time and place for more managerial goodness. Bye for now!