
Customer requests keep arriving. Defect reports enter your workflow alongside feature requests. One customer reports that an existing function didn’t work. Another asks for a new capability because the current product didn’t help them achieve their goal.
Every request looks like work your team needs to complete.
Your team stays busy, throughput remains steady, and yet your roadmap barely moves. You can see how many items your team finishes, but you can’t see why those items entered the workflow in the first place.
As you serve more customers, an increase in issues can seem natural. Some of those requests only exist because your target customers couldn’t achieve their goals using your product.
To measure rework in software teams, you need to separate the work your customers value from the work created by an earlier failure. One question makes that distinction visible: Would your customer be willing to pay for this request?
Separate Value Demand From Failure Demand
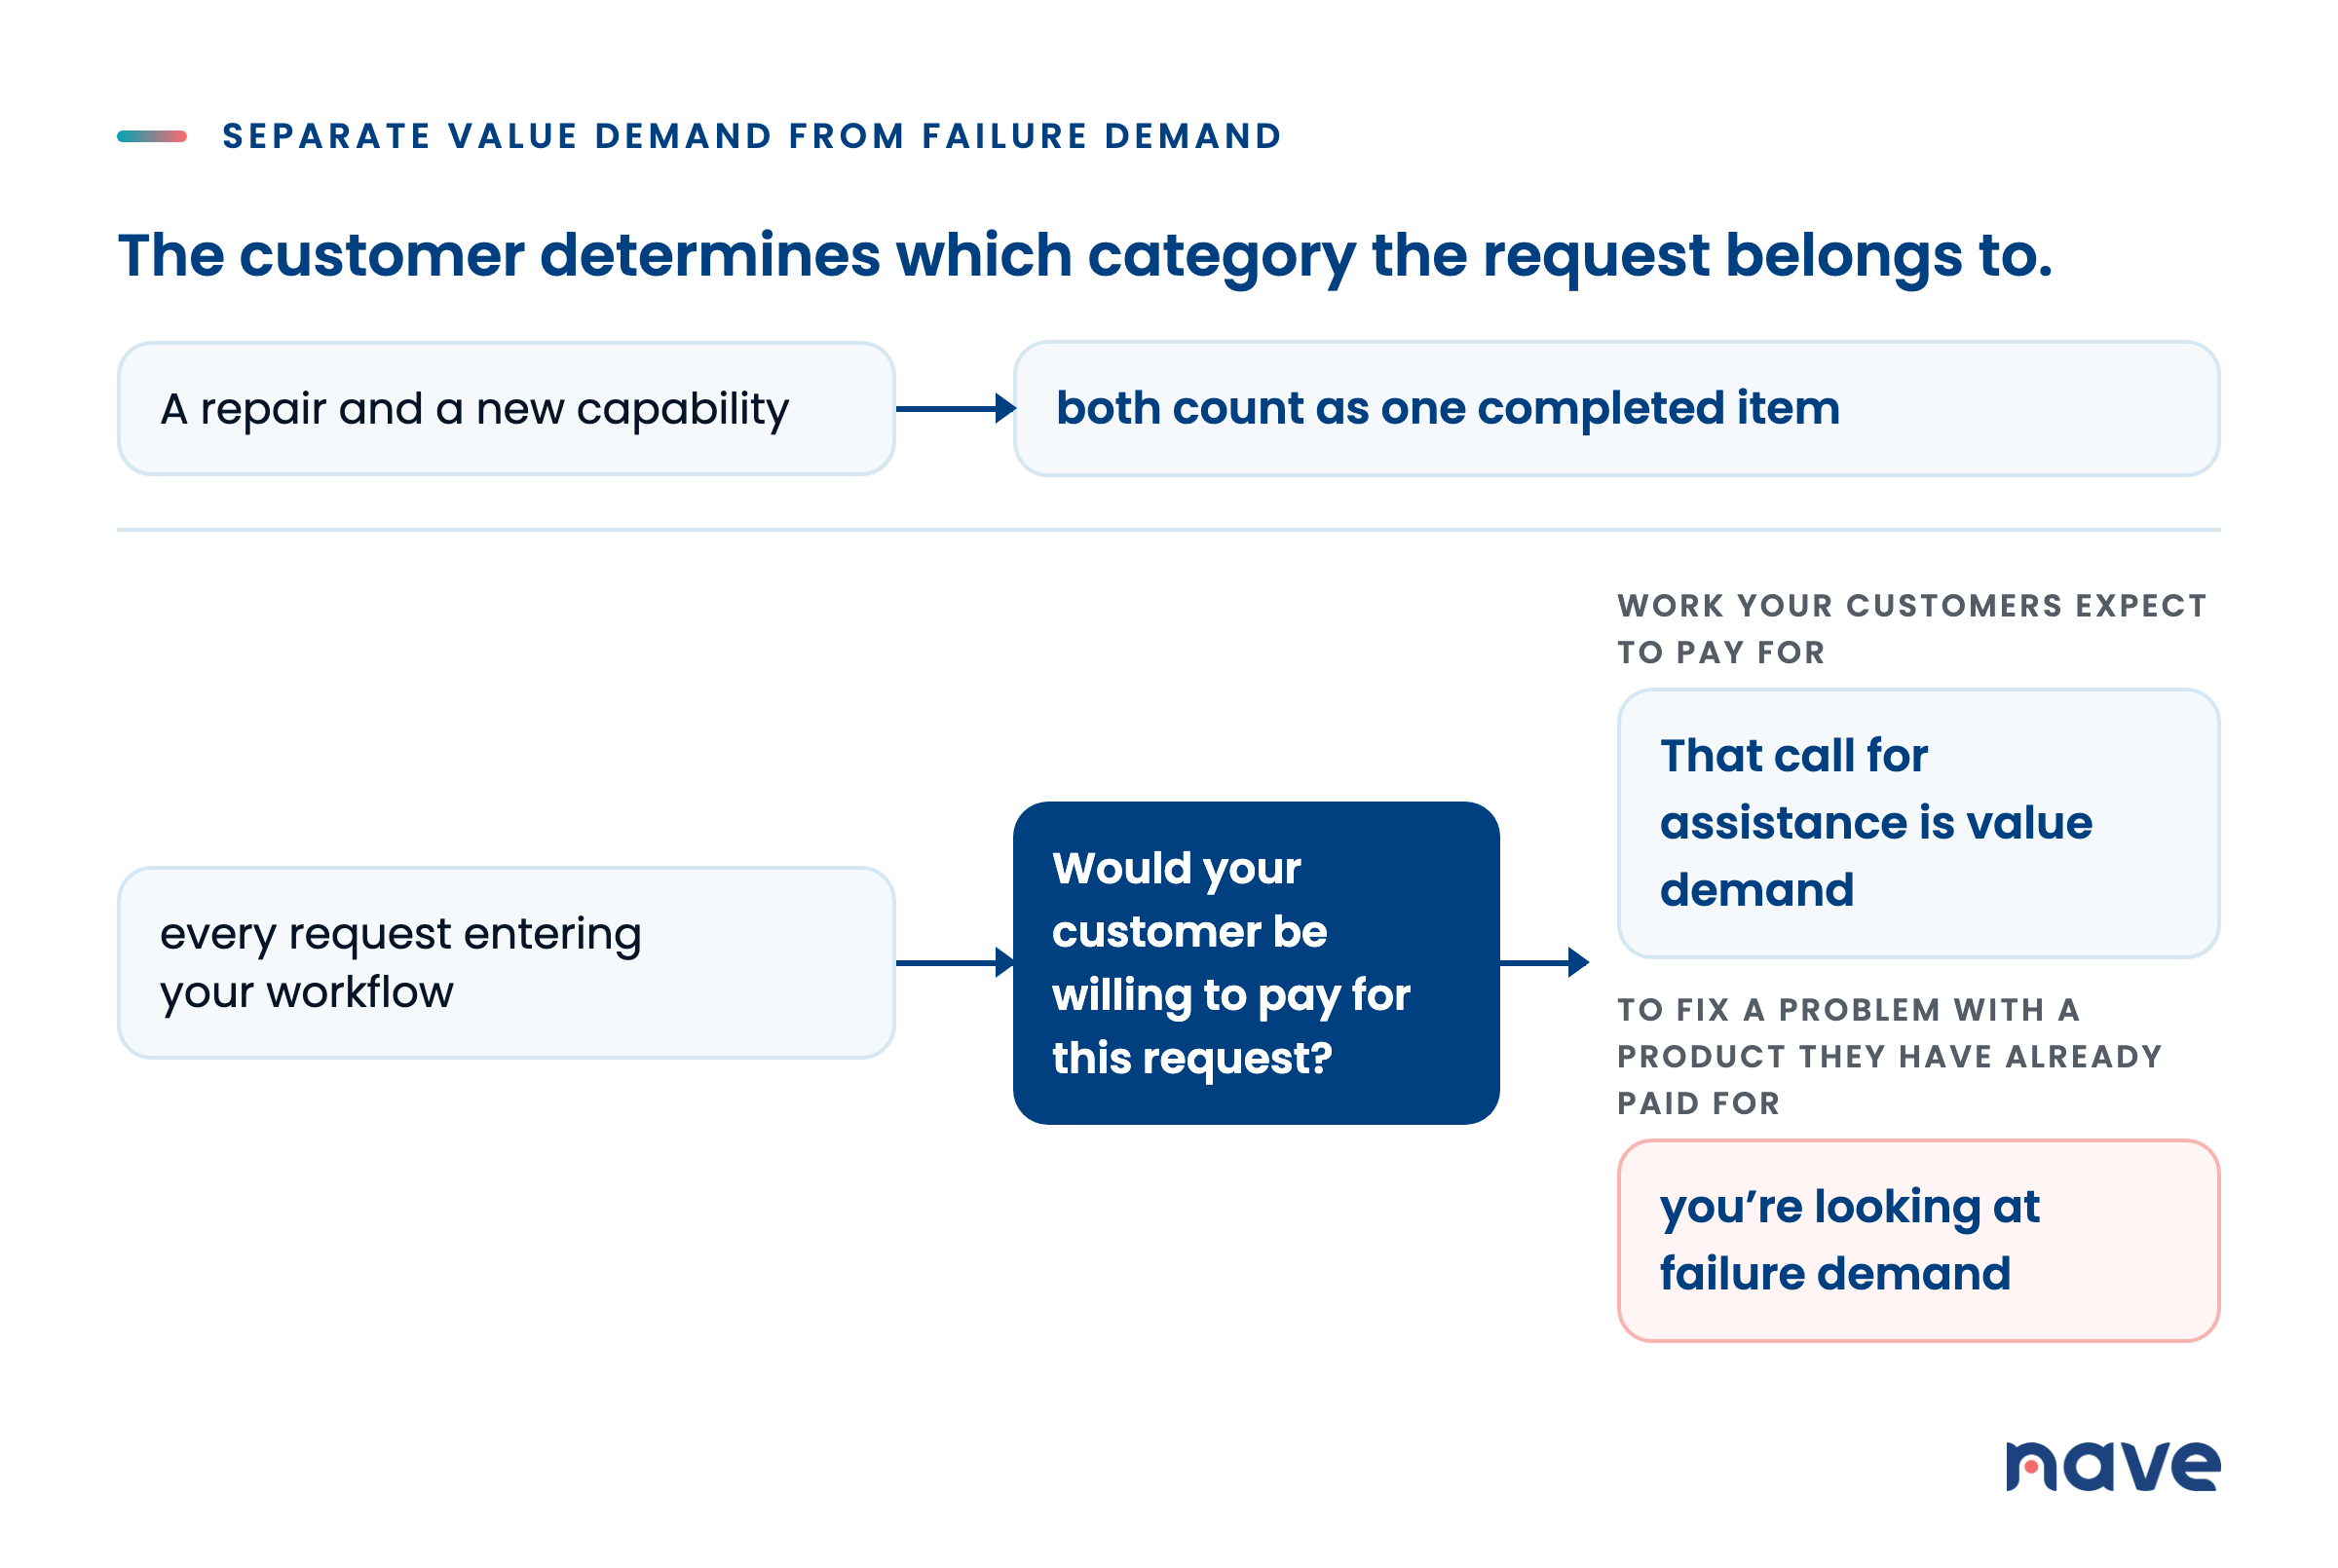
Value demand is work your customers expect to pay for. Your customer may accept that they are already paying for a customer support agent to be available 24 hours a day, seven days a week, to answer their call when they have a problem. That call for assistance is value demand.
Failure demand is different. It consists of requests that arise because your target customers couldn’t achieve their goals using your product.
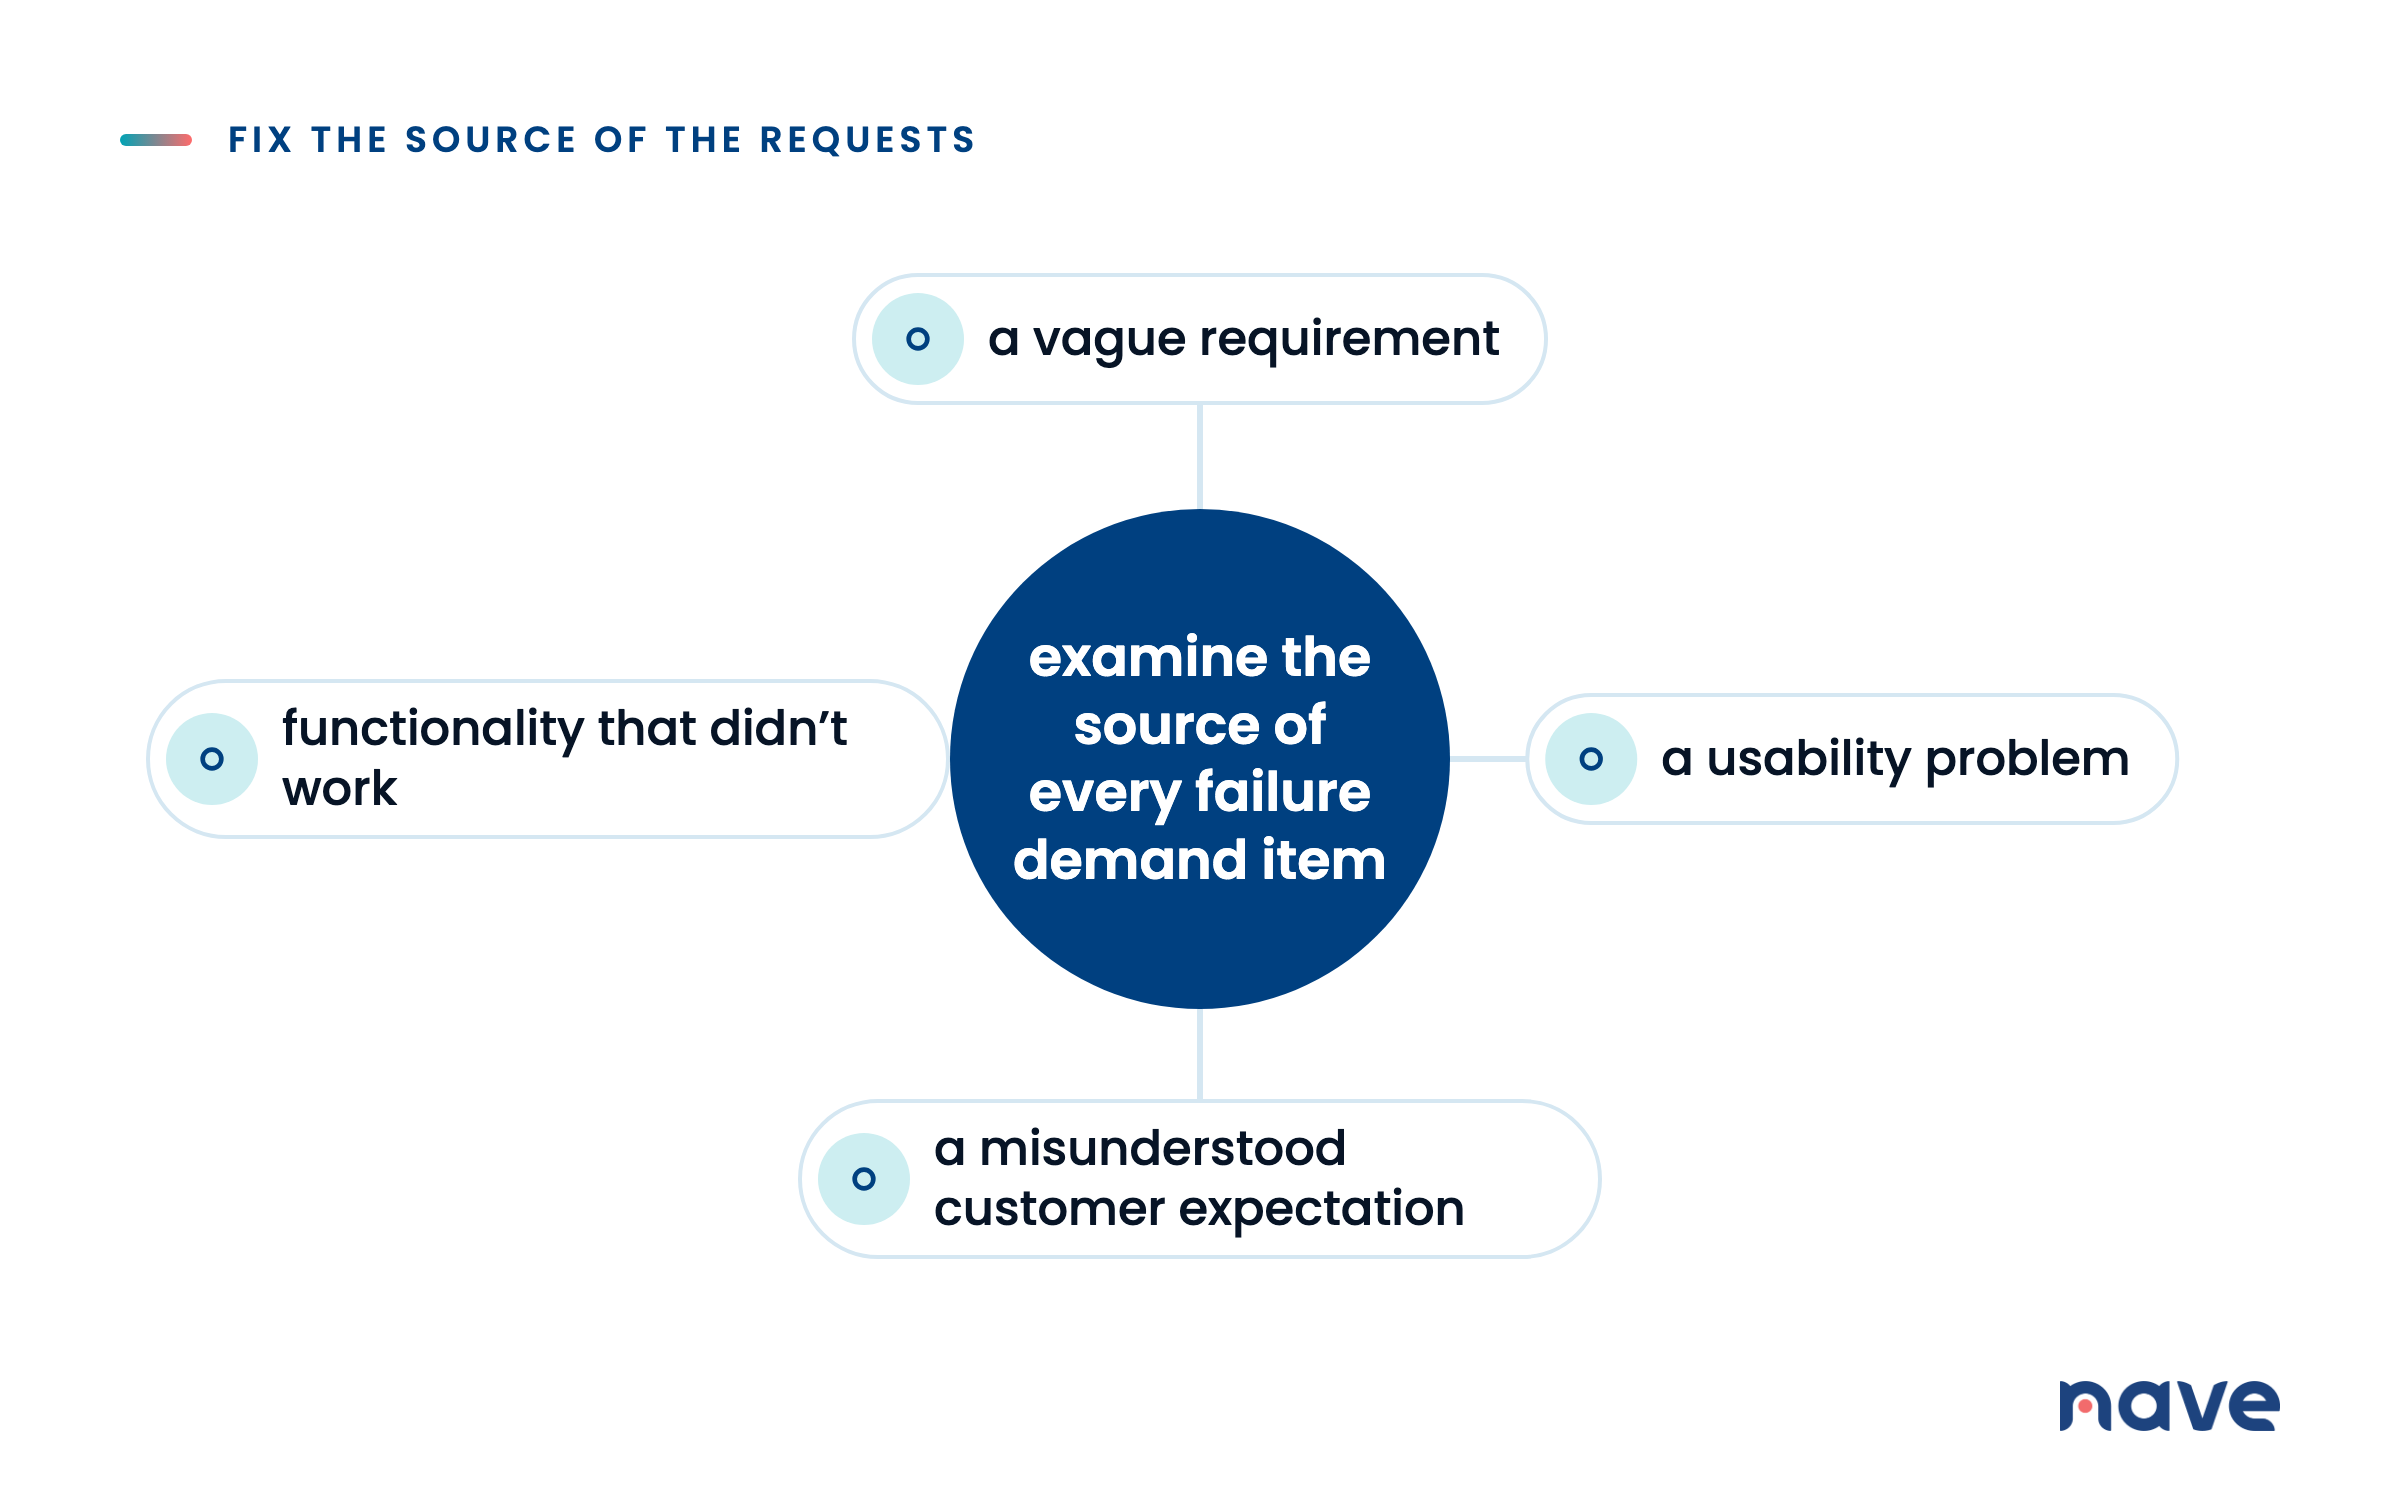
Defect fixes fall into this category. So does rework caused by a usability problem, a vague requirement, or a misunderstood customer expectation. Even a feature request can be failure demand when your customer asks for it because another function didn’t work.
Your team may need considerable skill and attention to complete the work. That doesn’t make it customer value. The request exists because something delivered earlier didn’t meet your customer’s needs.
The customer determines which category the request belongs to. Would they willingly pay you to fix a problem with a product they have already paid for? If the answer is no, you’re looking at failure demand.
This distinction explains why your throughput can remain steady while your roadmap barely moves. Throughput tells you how many items your team completed. It doesn’t tell you whether those items introduced new customer value or repaired earlier work.
If you’re unsure how to classify a request, label it as failure demand. Otherwise, repairs can disappear into a general work category and continue consuming your capacity without being examined separately.
Give Rework Its Own Shape in Your Workflow
Failure demand remains difficult to see when every request uses the same card, column, and label. A repair and a new capability both count as one completed item, even though they represent two different types of demand.
Start by defining explicit work item types for failure demand. You can distinguish between High-Impact Issues and Low-Impact Issues, then assign a separate label and color to each type. From that moment, every request entering your workflow declares whether it represents value demand or failure demand.
You don’t need to change anything else about the way your team works. Your first step is simply to expose the split that already exists.
Once your labels are in place, examine your completed work by type. A throughput breakdown shows each type of finished work as a share of everything your team completed during the selected period.
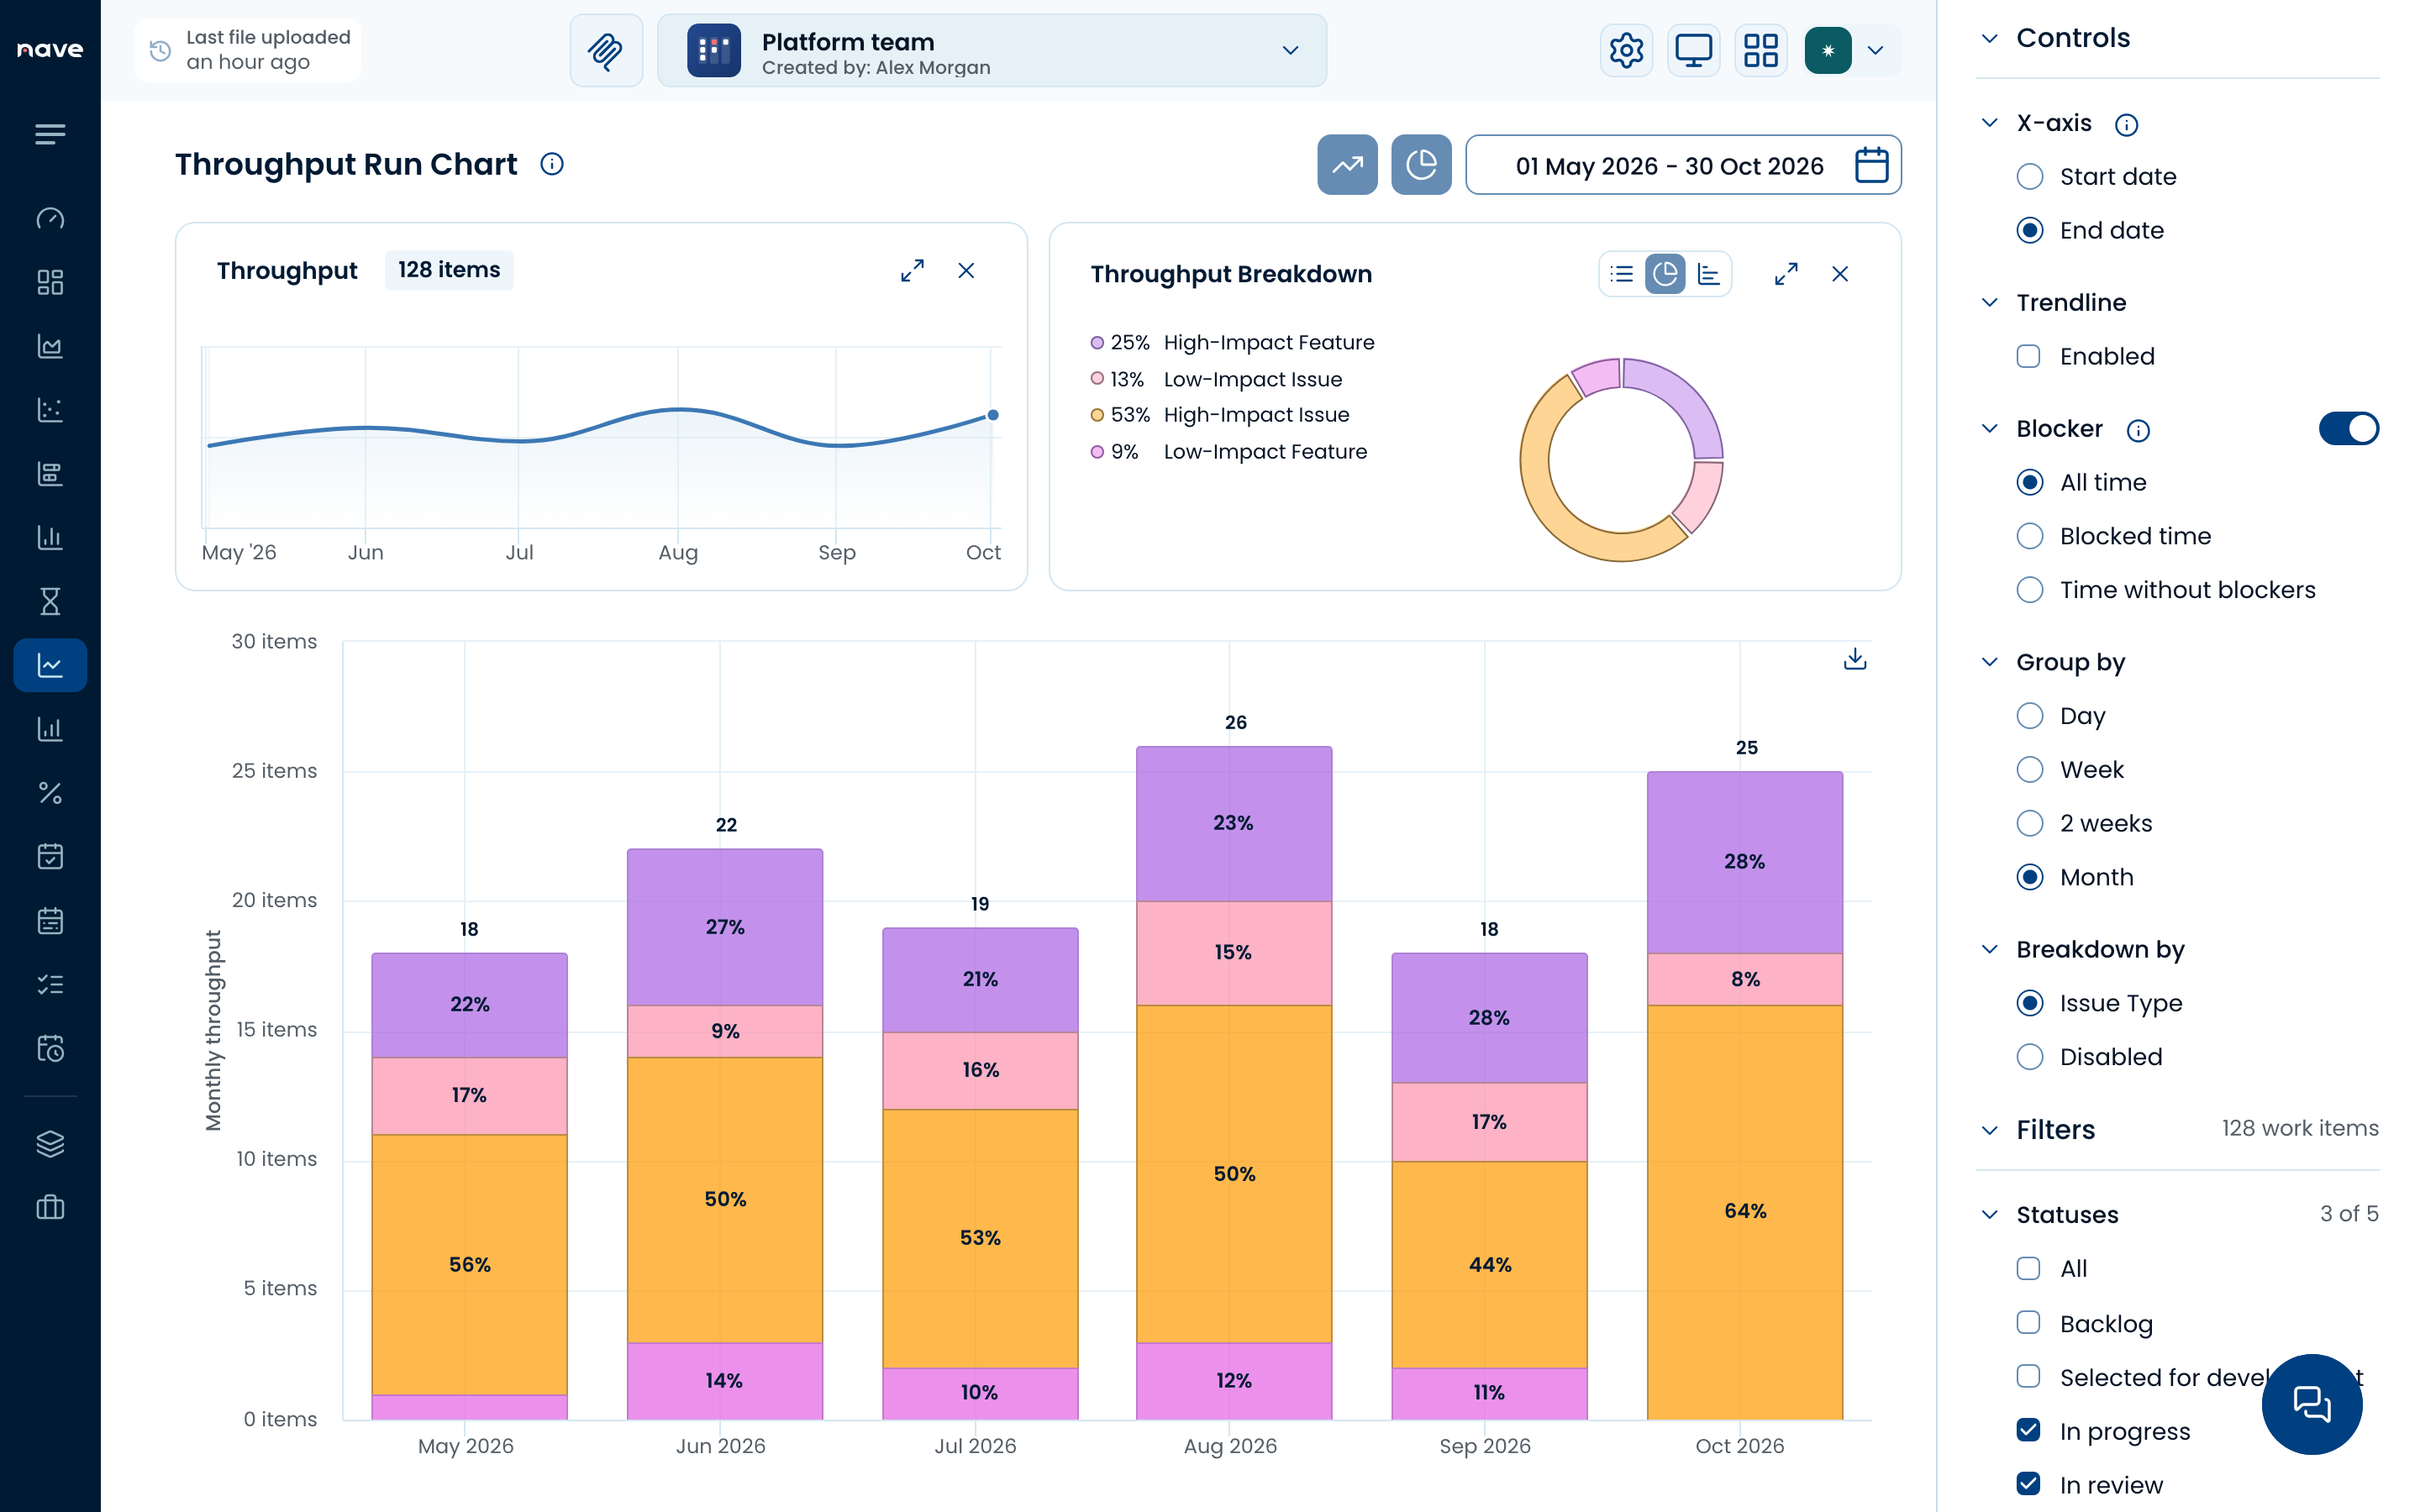
The Throughput Run Chart in Nave for 01 May to 30 Oct 2026, grouped by month and broken down by issue type. Across 128 finished items, the Throughput Breakdown panel shows High-Impact Issues at 53% and Low-Impact Issues at 13%. Learn more at getnave.com.
The two issue types account for 13 of 18 finished items in May, 13 of 22 in June, 13 of 19 in July, 17 of 26 in August, 11 of 18 in September, and 18 of 25 in October.
Across all six months, High-Impact Features represent 25% of completed work, while Low-Impact Features represent 9%. This breakdown reveals where your team’s capacity went. The count of value demand and failure demand gives you a baseline for winning that capacity back.
Fix the Source of the Requests
Rework is part of building software. Defects happen, requirements change, and nobody delivers a perfect first version every time.
The important question is the level at which natural change crosses into failure demand. A few repairs a month are the cost of building software. When two thirds of your throughput consists of repairs, your product is showing you that it doesn’t fit its customers yet.
While failure demand exists, resolve each customer problem as rapidly as possible. If your customer has to ask for the same thing twice, there may not be a third request.
Then, examine the source of every failure demand item. It may point to a vague requirement, a usability problem, a misunderstood customer expectation, or functionality that didn’t work. Resolving the individual request addresses the immediate problem. Fixing its source prevents those requests from continuing to arrive.
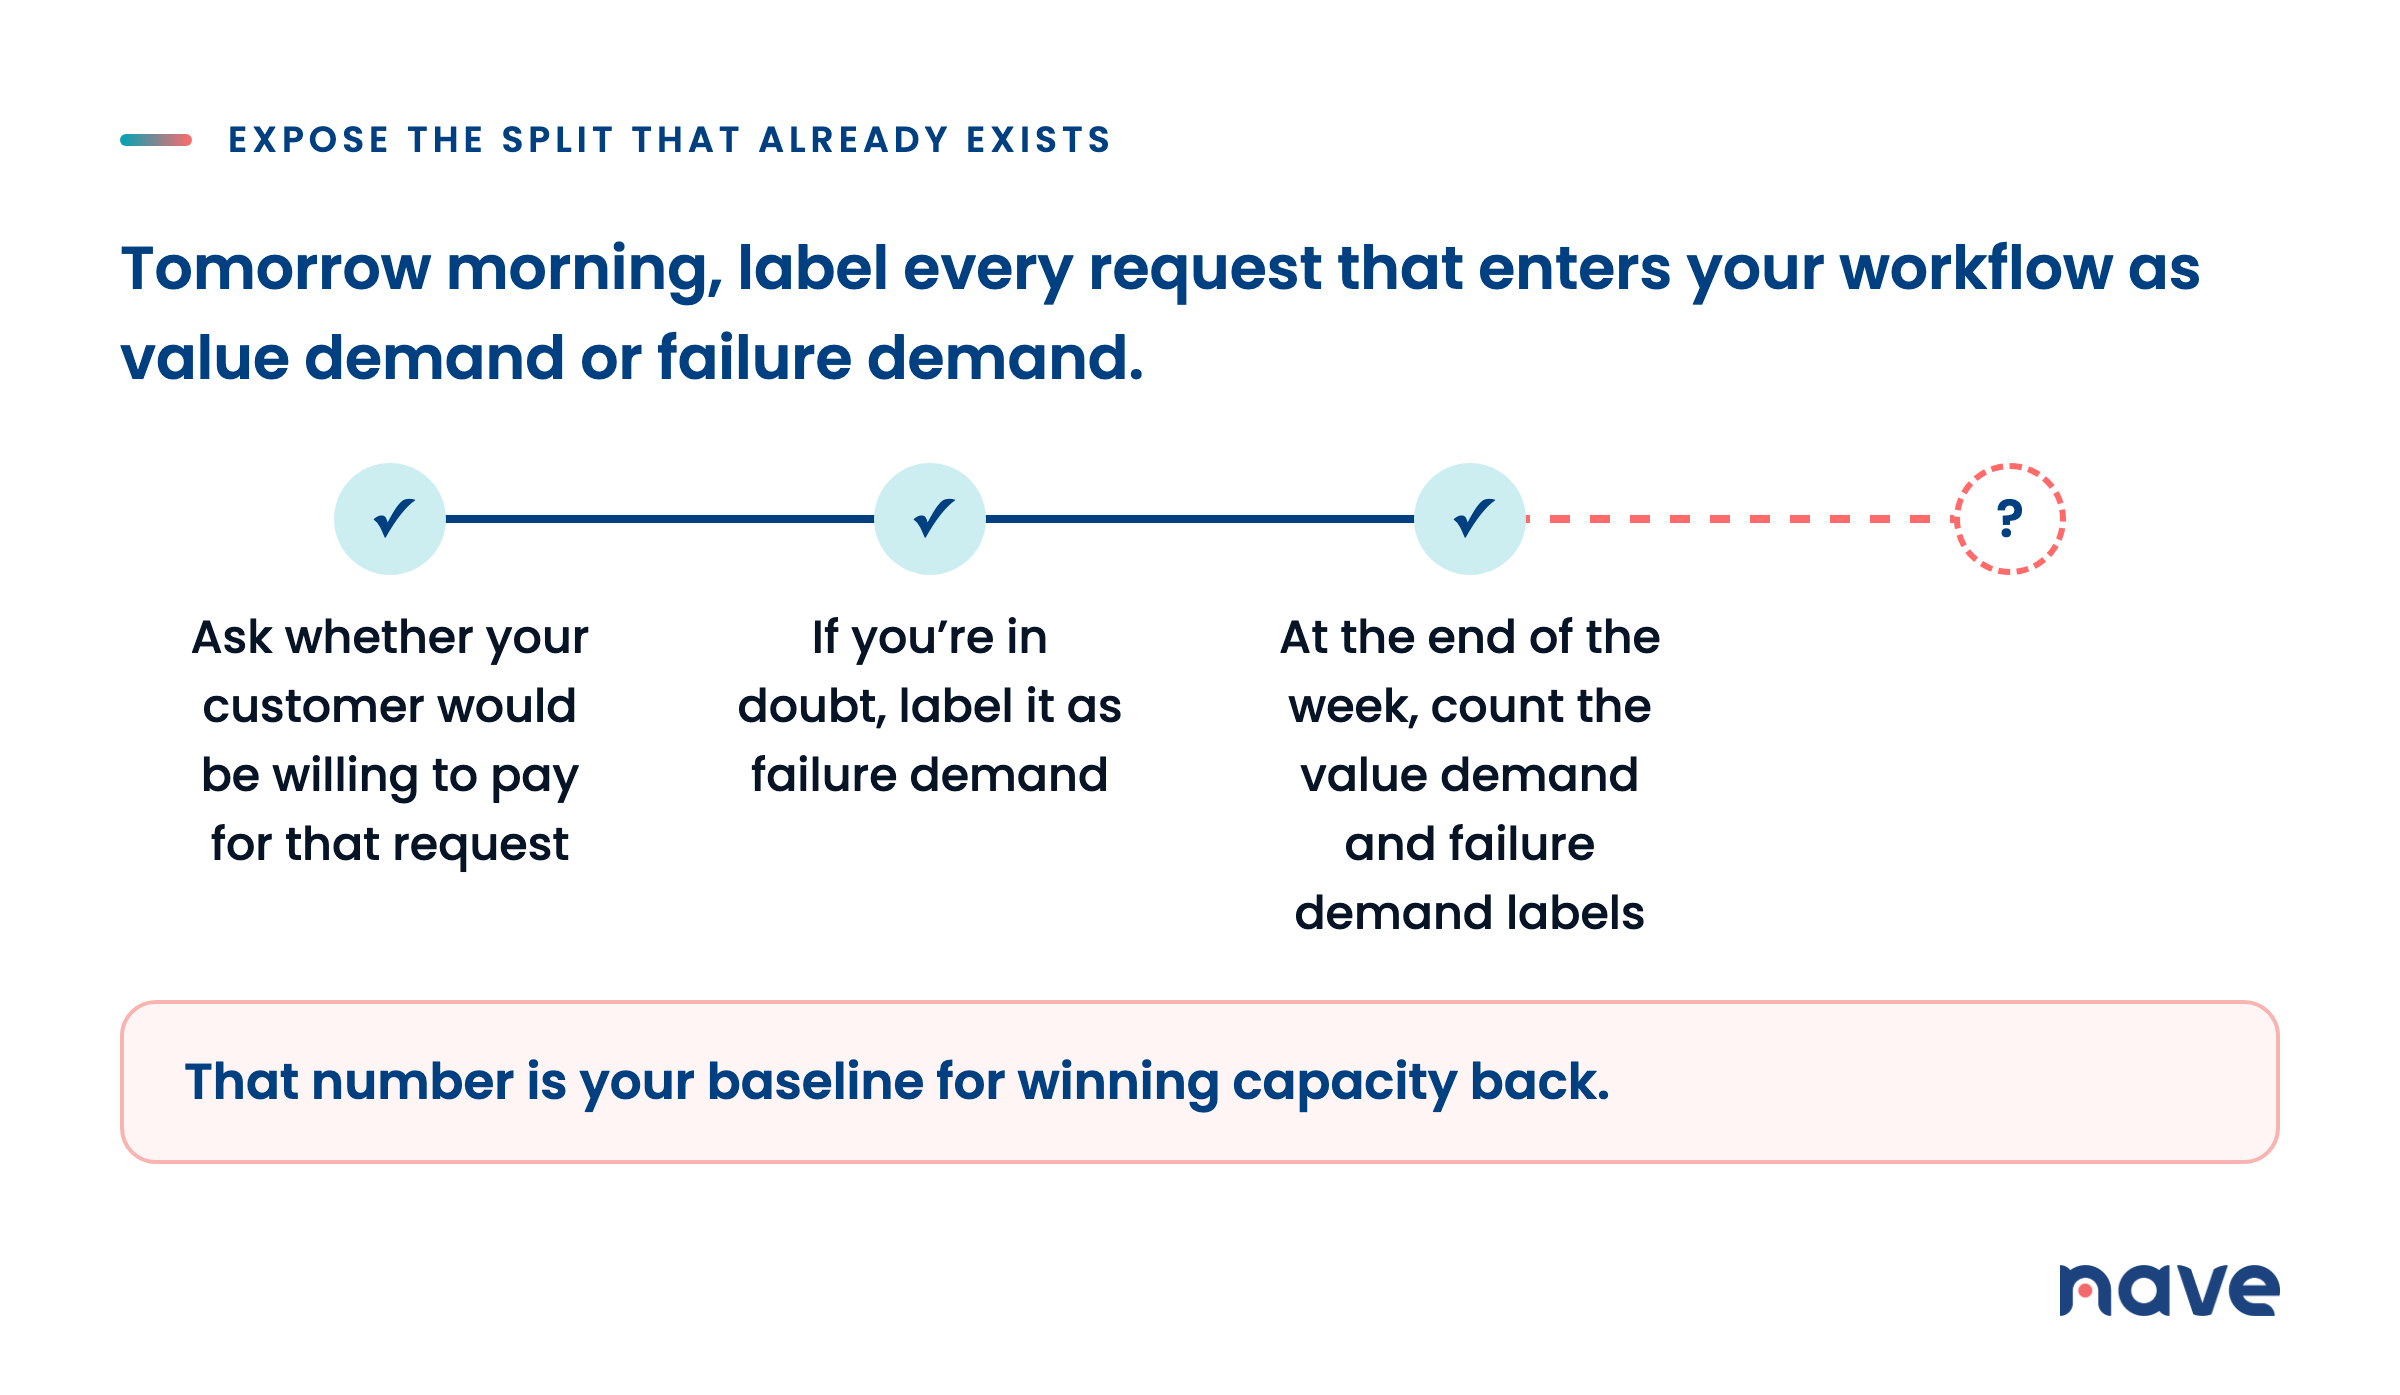
Tomorrow morning, label every request that enters your workflow as value demand or failure demand.
Ask whether your customer would be willing to pay for that request. If you’re in doubt, label it as failure demand.
At the end of the week, count the value demand and failure demand labels you placed on the requests that entered your workflow. That number is your baseline for winning capacity back.
When those labels expose where capacity goes, Nave helps delivery teams visualize their workflow, identify aging work and outliers, examine workflow stability, and use past performance to support delivery decisions. Learn more at getnave.com.
You can’t win back capacity until you can see how much of it is spent correcting earlier work.
I’ll see you next week, same time and place for more managerial goodness. Bye for now!